Sign up for The Week’s free daily newsletter, Today’s Best Articles
Join 350,000+ subscribers and keep yourself informed with a selection of
The Week’s most interesting, enlightening and entertaining stories - plus daily puzzles.
You are now subscribed
Your newsletter sign-up was successful
An account already exists for this email address, please log in.
Top 10 cities with booming house prices
Three of them are in California. And a certain bankrupt city in Michigan also made the list.
The rebound in the real estate market has attracted a great deal of attention this year. With the help of historically low interest rates and inventory levels, home prices have surged in many parts of the country.
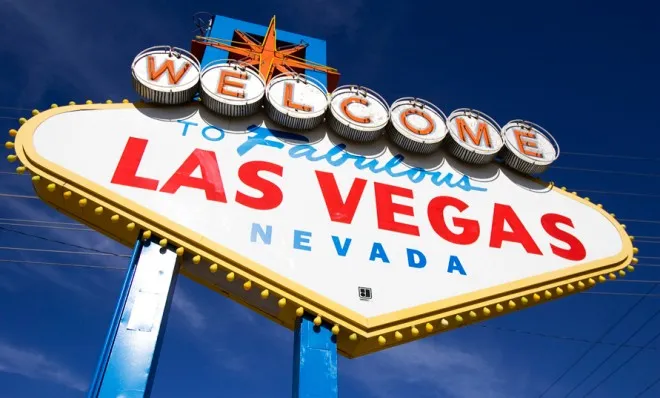
In June, home prices across the nation jumped an average of 12.1 percent according to the S&P/Case-Shiller composite index of 20 metropolitan areas, which is a three-month average. All 20 cities posted gains on a monthly and annual basis. Home prices are still 23 percent below their bubble peak but have bounced back nearly 50 percent since the March 2009 low. "National home prices rose more than 10 percent annually in each of the last two quarters," David M. Blitzer, chairman of the Index Committee at S&P Dow Jones Indices, said in a press release. "The Southwest and California have consistently led the recovery, with Las Vegas, Los Angeles, Phoenix, and San Francisco posting at least 15 months of gains. Looking at the cities, New York recorded its highest monthly return since 2002."
As they say in Real Estate 101, it's all about location. Here are the top 10 real estate markets by city, according to yearly price gains from S&P/Case-Shiller.
The Week
Escape your echo chamber. Get the facts behind the news, plus analysis from multiple perspectives.
Sign up for The Week’s free daily newsletter, Today’s Best Articles
Join 350,000+ subscribers and keep yourself informed with a selection of
The Week’s most interesting, enlightening and entertaining stories - plus daily puzzles.