What is inequality and why is it rising?
Wealth disparities are soaring but the gap in incomes is broadly unchanged

A free daily email with the biggest news stories of the day – and the best features from TheWeek.com
You are now subscribed
Your newsletter sign-up was successful
It's become a truism that some people are being left behind economically, with the word inequality now looming large over much of the country's political discourse.
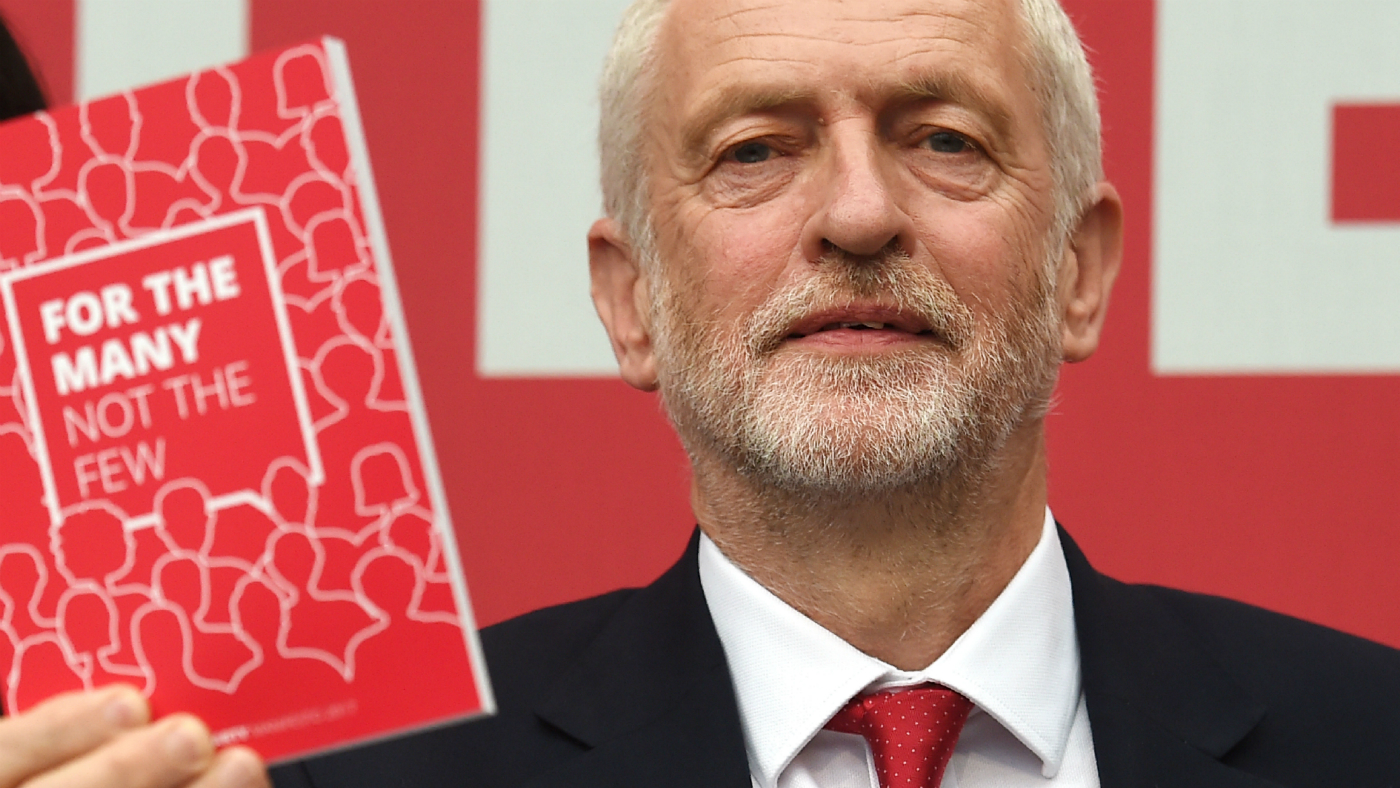
A number of experts say that inequality is responsible for the surprise vote for Brexit last June as well as the unexpected success of Jeremy Corbyn's harder-left Labour party earlier this month.
So, what is inequality? Is it rising? And if it is, what can we do about it?
The Week
Escape your echo chamber. Get the facts behind the news, plus analysis from multiple perspectives.

Sign up for The Week's Free Newsletters
From our morning news briefing to a weekly Good News Newsletter, get the best of The Week delivered directly to your inbox.
From our morning news briefing to a weekly Good News Newsletter, get the best of The Week delivered directly to your inbox.
How is inequality defined?
There are two different types of inequality.
First there is wealth inequality, which measures and compares the total accumulated wealth of individuals including their housing equity, pensions and other savings and assets.
Then there is income inequality, which instead looks at disparities in disposable income after tax.
A free daily email with the biggest news stories of the day – and the best features from TheWeek.com
Both of these are not the same as poverty, which is defined in either "relative" terms to average earnings, or in "absolute" terms compared to average earnings of several years earlier to give a sense of change over time.
So is inequality rising?
A headline in The Guardian this morning cites a "huge inequality gap" in wealth terms, thanks to a £2.3trn windfall "for those lucky enough to own their homes during the property boom of the 1990s and early 2000s".
In short, older people, in particular, were more likely to own their own home going into this period of property prosperity and so their total assets have risen along with house prices.
The conclusion is based on figures from the Resolution Foundation, which also found that private pensions are the biggest part of long-term wealth.
This benefits older people – particularly baby boomers – disproportionately as they were working at a time when more generous final salary pensions were the norm.
What about income inequality?
Here the picture is very different. A House of Commons Library found income inequality has been steady since the early 1990s and has actually fallen slightly since 2008.
This is basically because real earnings after inflation have declined since the financial crisis, while benefits have remained steadier – albeit still below the rate of inflation.
The so-called "one per cent" of the very highest earners did better until the early 2000s, but even they have experienced falling disposable incomes since the crisis.
According to the Financial Times the share of total before tax income fell for this group from 13.4 per cent to 12.3 per cent between 2007/8 and 2014/15, while the share of total tax revenue increased from 24 per cent to 27 per cent.
In short, the very rich are earning less and paying more in tax in a more "progressive" system.
And poverty?
It's slightly more complicated still.
Relative poverty, which is the share of people earning less than 60 per cent of national average earnings, was broadly unchanged between 1995/1996 and 2015/2016 at a little above 20 per cent, according to Full Fact.
Absolute poverty, which tracks the share of people earning less than 60 per cent of income from five years earlier, fell markedly from 40 per cent to around 20 per cent over that time.
Notably, pensioner poverty fell more sharply as a result of policies like the pensions "triple lock" from over 50 per cent to around 15 per cent.
Equally notable, the Joseph Rowntree Foundation says child poverty – measuring the proportion of children living in a home in relative poverty – is actually rising right now as a result of specific benefits reforms.
What does all this mean?
A key point in all this is that the absolute level of wealth in the UK has not kept pace with inflation. Average total assets per UK household have fallen from £99,000 in 2006-2008 to £84,000 in 2012-2014, according to the Resolution Foundation.
Real incomes have also declined overall since the crisis and are not expected to return to their pre-2008 levels until 2022.
So, while the picture on poverty is mixed but certainly not devastating – and income inequality, especially since the national living wage was introduced, is in modest decline – overall people are worse off on average.
At a time when the cost of living is rising, which affects those at the bottom of the income distribution range most, this perhaps explains why so many people feel so left behind.
-
 What are the best investments for beginners?
The Explainer Stocks and ETFs and bonds, oh my
-
 What to know before filing your own taxes for the first time
the explainer Tackle this financial milestone with confidence
-
 The biggest box office flops of the 21st century
in depth Unnecessary remakes and turgid, expensive CGI-fests highlight this list of these most notorious box-office losers