Facebook's first year as a public company: By the numbers
A look at how the social giant has fared on Wall Street

A free daily email with the biggest news stories of the day – and the best features from TheWeek.com
You are now subscribed
Your newsletter sign-up was successful
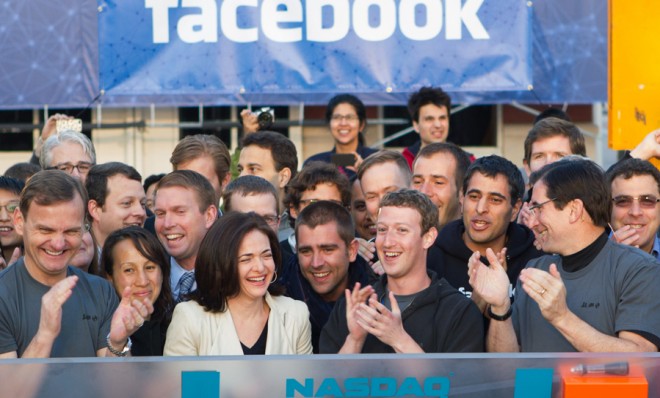
On May 18, 2012, Mark Zuckerberg, wearing one of his signature black hoodies, rang the opening bell on the Nasdaq stock market, kicking off trading for Facebook — one of the most highly anticipated IPOs in history.
Immediately, the market went bonkers: Nasdaq's systems couldn’t handle the tsunami of trading volume, and broke down. As Facebook lawyers later suggested in a legal filing, the nail-biting half-hour spooked investors and drove down share prices. After years of buildup, shares of Facebook closed almost flat on the first day of trading.
It turned out to be a fitting omen. Facebook's share price has declined markedly as it struggles to explain how it will earn the kind of revenue its giant IPO promised. Here are some of the numbers behind Facebook’s first year as a publicly traded company:
The Week
Escape your echo chamber. Get the facts behind the news, plus analysis from multiple perspectives.

Sign up for The Week's Free Newsletters
From our morning news briefing to a weekly Good News Newsletter, get the best of The Week delivered directly to your inbox.
From our morning news briefing to a weekly Good News Newsletter, get the best of The Week delivered directly to your inbox.
$104 billion
The total value of Facebook's IPO
$63.2 billion
Facebook's current market cap
A free daily email with the biggest news stories of the day – and the best features from TheWeek.com
100
Number of times the company’s earnings were multiplied to reach its original valuation
25
Percentage increase in shares Facebook released for sale just before the IPO, due to heavy investor demand
30
Minutes Facebook trading was delayed on the first day, due to technical glitches
$38
Original stock price
$43
The high Facebook shares reached on the first day
$38.23
Closing stock price on the first day
$26
Facebook's current share price (give or take)
$10 billion
Facebook revenue from its initial public offering
30
Percent Facebook's share price has dropped since opening day
$1.06 billion
Revenue from the first quarter of 2012, before it was public
$1.46 billion
Revenue from Facebook's most recent quarter
85
Percent of revenue Facebook made from right-column desktop ads before the IPO
30
Percent of revenue Facebook now makes from mobile advertising
1.11 billion
Active Facebook users as of March
1.06 billion
Active users in December 2012
$5.32
Average revenue Facebook earned per user in 2012
Sources: The Los Angeles Times, The Wall Street Journal, TIME
Carmel Lobello is the business editor at TheWeek.com. Previously, she was an editor at DeathandTaxesMag.com.
-
 Political cartoons for February 16
Cartoons Monday’s political cartoons include President's Day, a valentine from the Epstein files, and more
-
 Regent Hong Kong: a tranquil haven with a prime waterfront spot
The Week Recommends The trendy hotel recently underwent an extensive two-year revamp
-
 The problem with diagnosing profound autism
The Explainer Experts are reconsidering the idea of autism as a spectrum, which could impact diagnoses and policy making for the condition