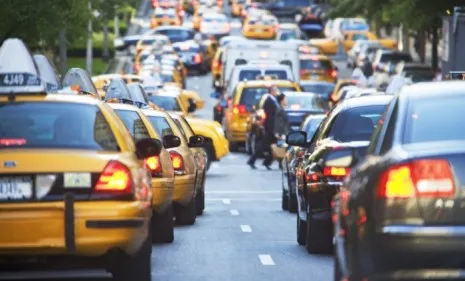
In a depressing sign of economic recovery, gridlock is once again clogging the roadways of America, according to the Urban Mobility Report, an annual study of traffic released by the Texas Transportation Institute. During the economic slowdown that took hold in 2008, fewer people drove to work (or to shopping centers), leaving congestion "better than it had been in a decade," reports NPR. But as the economy began to recover in 2009, traffic began to jam anew and is now re-approaching boom-time highs. Here's a by-the-numbers look at the problem:
14
Hours the average American wasted in traffic in 1982, the first year for which there are records
The Week
Escape your echo chamber. Get the facts behind the news, plus analysis from multiple perspectives.
SUBSCRIBE & SAVE
Sign up for The Week's Free Newsletters
From our morning news briefing to a weekly Good News Newsletter, get the best of The Week delivered directly to your inbox.
From our morning news briefing to a weekly Good News Newsletter, get the best of The Week delivered directly to your inbox.
Latest Videos From
39.1
Hours the average American wasted in traffic in 2006 (an all-time high)
33.7
Hours the average American wasted in traffic in 2008, down almost 14 percent from 2006
34
Hours the average American wasted in traffic in 2009 as the recovery began
70
Hours an average commuter in Chicago or Washington, D.C. — the worst areas for congestion — lost to traffic jams in 2009
3.9 billion
Gallons of gas Americans wasted sitting in traffic in 2009
$808
Cost to the average American commuter of the time we spent stuck in traffic in 2009 (in terms of "wasted fuel, lost work hours," among other metrics)
$351
Cost, adjusted for inflation, to the average commuter of the time we spent stuck in traffic in 1982
4.62 billion
Number of total hours Americans spent in traffic in 2009
5.25 billion
Number of hours Americans spent in traffic in 2006, the all-time high
9.3 percent
Unemployment rate in 2009
4.6 percent
Unemployment rate in 2006
439
Number of "urban areas" the report studied
60
Percentage of people expected to live in urban areas by 2030. "That will require — no, it will demand — that we embrace multimodal, not car-centric, transportation systems," says Chuck Squatriglia at Wired
Sources: Wired, NPR, New York Times