Check out these fascinating experiments in Ngram art
Words are strange creatures that do not necessarily behave as you would expect when graphed over time

A free daily email with the biggest news stories of the day – and the best features from TheWeek.com
You are now subscribed
Your newsletter sign-up was successful
Google Ngram Viewer is a tool that allows users to search for a word or phrase in Google's vast collection of digitized books and graph the results.
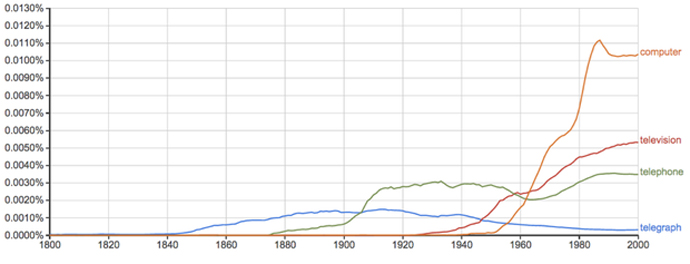
The above graph shows the use of words for various technologies over time. Telegraph had its modest moment in the early 20th century. Telephone started its rise right after it had its first major public demonstration in 1876. Television had a steep increase mid-century, but was quite outdone by the sharp leap taken by computer in the second half of the century.
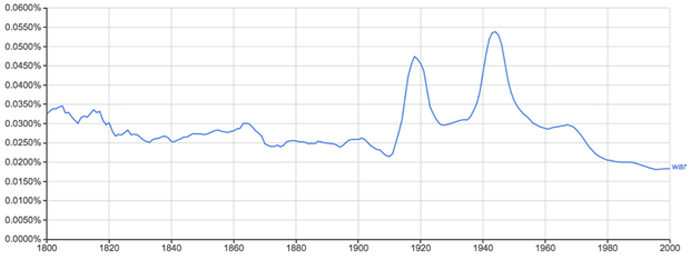
A lot of what you find exploring Ngram is pretty obvious. Above, a search on the word war shows major peaks in its usage during both world wars.
The Week
Escape your echo chamber. Get the facts behind the news, plus analysis from multiple perspectives.
Sign up for The Week's Free Newsletters
From our morning news briefing to a weekly Good News Newsletter, get the best of The Week delivered directly to your inbox.
From our morning news briefing to a weekly Good News Newsletter, get the best of The Week delivered directly to your inbox.
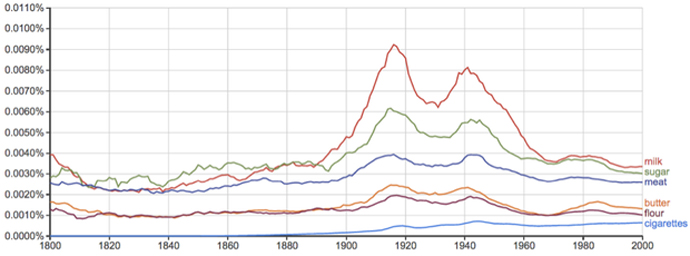
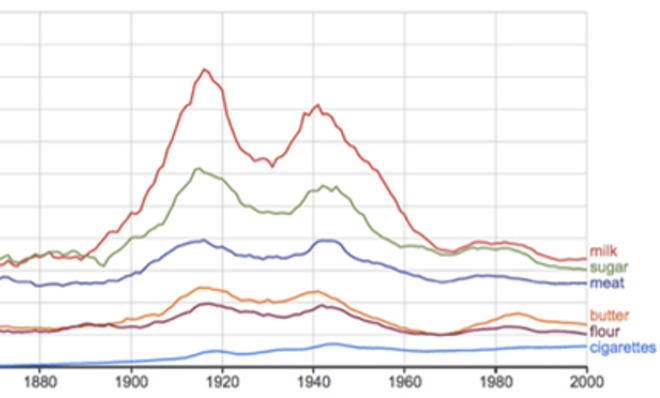
But you can also discover patterns that aren't so obvious. Milk, sugar, meat, butter, flour, and cigarettes also had peaks during the world wars. In retrospect, this might seem obvious — it probably has to do with the rationing and shortages associated with wartime — but interesting to see it so clearly outlined on the basis of word use alone.
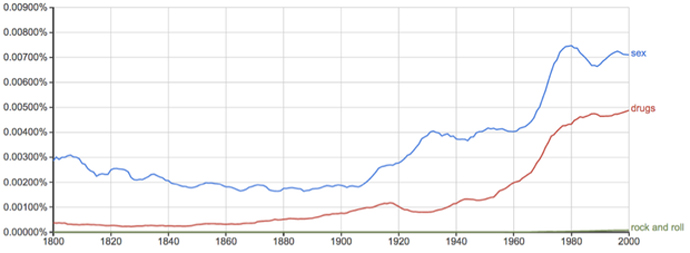
It's important to be aware of scaling when comparing words on Ngram. The y-axis shows percentages over all the words in the Google Books corpus. Sex went from .004 percent of words in 1960 to .007 percent in the year 2000. Its rise is paralleled over the same period with that for drugs. But it appears there isn't much to say about rock and roll.
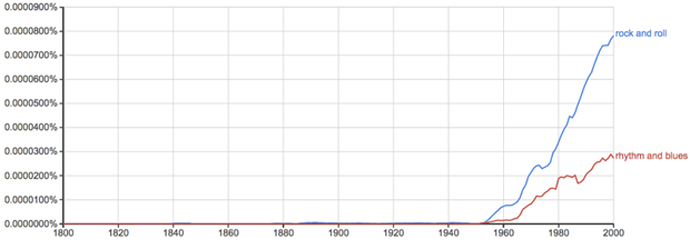
Not so! Rock and roll had its own meteoric rise, just on a much smaller scale, percentage-wise. By 2000, it had gone from 0 to .00008 percent of all three-word chunks. (The "n" in "Ngram" refers to the number of sequential units considered as a chunk. Single words are 1-grams, two word phrases are 2-grams, three word phrases are 3-grams…). It's hard to see that when it has to share the stage with relative giants like sex and drugs.
Now, Ngram art is something I discovered through hours of playing with Ngram. I use Ngram frequently to answer questions or satisfy my curiosity about linguistic change. Sometimes I get sucked into a zone where I'm just throwing random words and phrases at it to see what happens. One late night, I noticed that in the graph for high and low, the image matched the meaning of the words. On the graph, high was high and low was low.
A free daily email with the biggest news stories of the day – and the best features from TheWeek.com
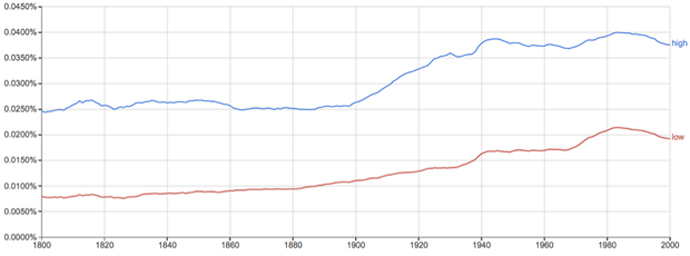
Soon I was chasing those moments of serendipity down, trying to choose the right words to make line images that would relate back their meanings. It wasn't as easy as it looks. Words are strange creatures that do not necessarily behave as you would expect when graphed over time. Still, I discovered it was possible, in a crude way, to draw with data. Here is the resulting small gallery of Ngram art.
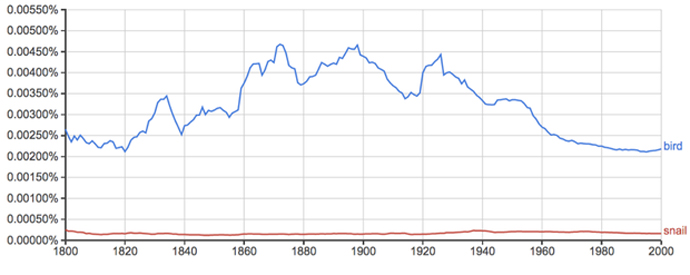
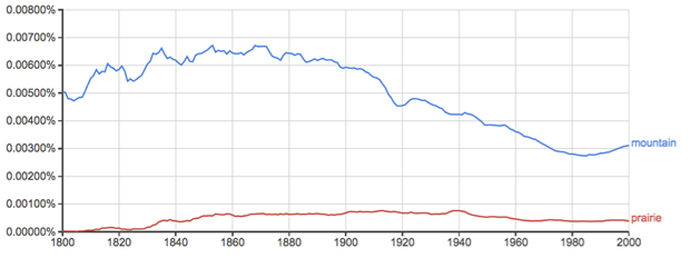
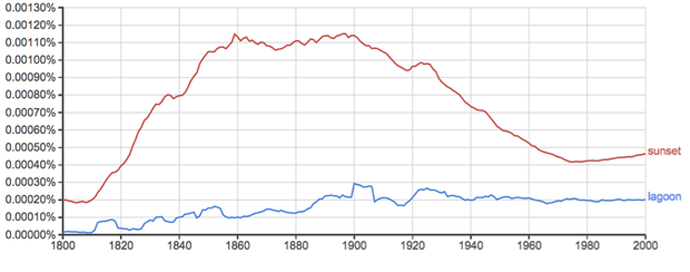
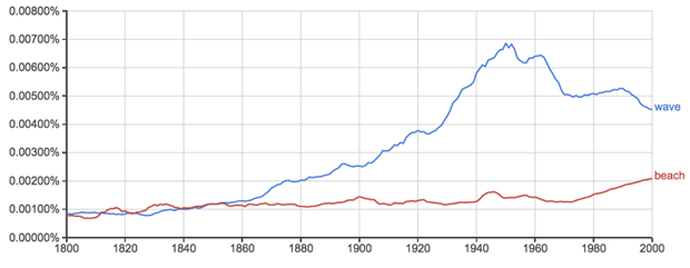
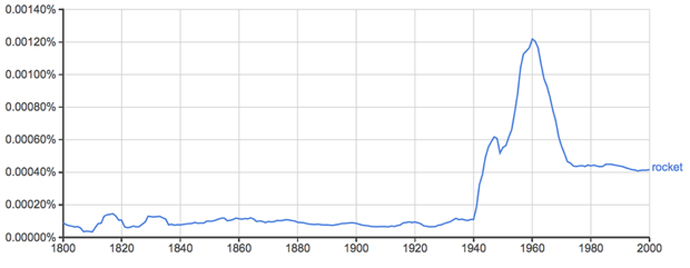
If you'd like to try your hand at Ngram art visit the Ngram Viewer. If you'd like to know more about how Ngram works and what its results mean see this TED talk by the creators Jean-Baptiste Michel and Erez Lieberman Aiden. For information on some of the more complex searches you can do, see this Atlantic article by Ben Zimmer.
Arika Okrent is editor-at-large at TheWeek.com and a frequent contributor to Mental Floss. She is the author of In the Land of Invented Languages, a history of the attempt to build a better language. She holds a doctorate in linguistics and a first-level certification in Klingon. Follow her on Twitter.
-
 ‘My donation felt like a rejection of the day’s politics’
Instant Opinion Opinion, comment and editorials of the day
-
 Trump wants a weaker dollar but economists aren’t so sure
Talking Points A weaker dollar can make imports more expensive but also boost gold
-
 Political cartoons for February 3
Cartoons Tuesday’s political cartoons include empty seats, the worst of the worst of bunnies, and more
