The economy is weaker than it looks
Why do people dislike Trump? Look below the surface of the economy.


Political scientists have argued consistently that by far the most important factor influencing the political success of the party in power is economic performance. That has many people scratching their heads at President Trump's abysmal polling, which hovers below 40 percent approval at a time when the unemployment rate is at 4.1 percent and falling.
Ordinary people might not be quite the dimwitted clods often portrayed by political science. But the economy is also substantially weaker than it appears — weakness that will likely be exacerbated by the Trump tax bill. As the midterms approach, it will be critical to look below the half-decent headline figures and grasp the epic economic failure of America's first lost decade.
Let me start with economic growth per person, the traditional metric of economic success. In the period from 1948 through 2006, inflation-adjusted GDP growth cruised along at 1.91 percent per year, according to the Bureau of Economic Analysis. But in the subsequent 10-year period from 2007-2016, growth was an appalling 0.61 percent on average. That partly reflects the large decreases from 2008-09 during the Great Recession, but even if we leave them out, average growth from 2010-16 was a mere 1.4 percent — a terrible result in itself that is even worse when you consider it should have been much faster than average in order to undo the damage of the recession.
The Week
Escape your echo chamber. Get the facts behind the news, plus analysis from multiple perspectives.

Sign up for The Week's Free Newsletters
From our morning news briefing to a weekly Good News Newsletter, get the best of The Week delivered directly to your inbox.
From our morning news briefing to a weekly Good News Newsletter, get the best of The Week delivered directly to your inbox.
So what about the first year of the Trump presidency? Full data for 2017 is not in yet, but preliminary growth estimates have only been a bit better, at an average of 2.6 percent for the first three quarters, hardly enough to restore the average.
Or consider productivity growth — perhaps a better overall indicator, since it can account for GDP changes due to working hours. U.S. nonfarm GDP per hour worked increased at an average of 1.96 percent from 1948 to 2006. As against the abysmal raw growth numbers, productivity has been merely very poor, coming in at 1.23 percent from 2007-2016. But that number has in turn been boosted by large productivity gains in 2009-10, likely as a result of businesses streamlining their workforce under extreme duress — a one-off event that can't be repeated. From 2011-16, productivity has averaged a meager 0.59 percent. The year 2016 was worst of all, coming it at slightly less than zero. Estimates of 2017 are at least better than this, but not that great either, at 1.1 percent over the first three quarters.
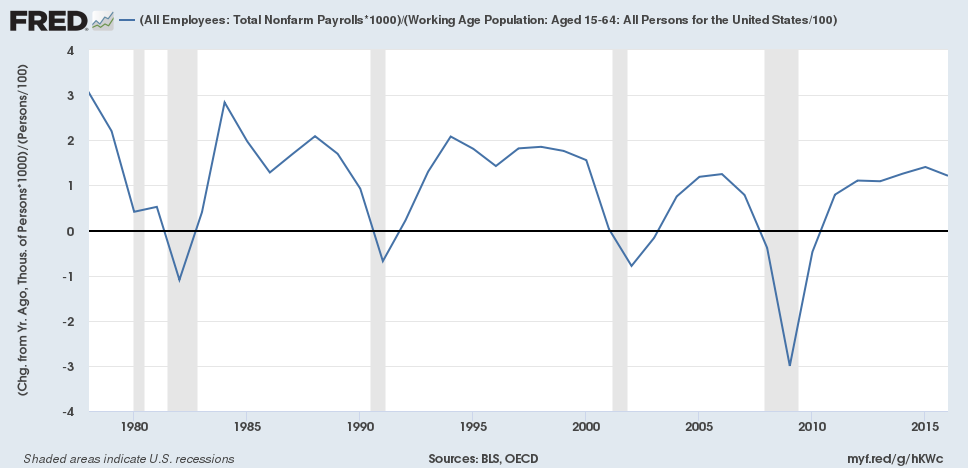
Or consider jobs. One way to measure this is to examine employment growth for every 100 members of the 15-64 population. That gives job creation scaled to the employable population (or "employables"), divided simply so you don't end up with an unwieldy tiny fraction (and only going back to 1978 as that's the limit of the population survey):

A free daily email with the biggest news stories of the day – and the best features from TheWeek.com
From 1978 (a somewhat arbitrary starting choice, but still giving a decent rough estimate) to 2006, America averaged 1.04 new jobs per 100 employables per year. From 2007-16, it averaged a measly 0.38 new jobs on this metric. Once again, 2017 estimates of job growth find them in line with the previous few years. It's not surprising that the fraction of the prime working-age population (aged 25-54) with a job only reached the level of the bottom of the previous recession in January 2017, and remains nearly 3 percentage points below its 2000 peak.
To sum up: A decade in which per capita GDP growth clocks in at less than one-third its previous average, productivity less than two-thirds, and job creation just over one-third unquestionably qualifies as a Japan-style lost decade. As mentioned above, 2017 has been about average compared to the past few years. What would be needed to break America out of this rut would be a huge surge in these indicators, sustained over several years. In reality, it seems we are already well into lost decade number two, and will stay there indefinitely.
The Trump tax bill will probably make things worse. Tax cuts will theoretically stimulate the economy to some degree, but as seen from a similar experiment in Kansas, their extreme tilt towards the rich will almost certainly inspire a lot of tax avoiding instead of productive investment. Furthermore, anything that increases inequality (as the Trump tax bill will do) will tend to harm growth and output by putting more of the national income in the hands of people who will hoard instead of spend, while simultaneously increasing the likelihood of asset bubbles as rich people look for somewhere to sock their money away in a severely top-heavy economy.
Indeed, in many ways America is doing considerably worse than Japan has done in similar circumstances. Our unemployment crisis was dramatically worse, and our welfare state is a grotesque abomination by comparison. As a result, alone among developing nations, the United States is experiencing declines in life expectancy for two years running now, partly by mass-casualty diseases of despair like alcoholism and opioid addiction. And who knows when the next financial crisis might strike?
Trump's unpopularity is no doubt largely driven by the fact that he is a terrible person, prone to racist and sexist remarks and incapable of impulse control. But some is also probably due to the fact that while the economy seems okay on the surface, it sure doesn't feel like it for a lot of people — and rightly so.
Ryan Cooper is a national correspondent at TheWeek.com. His work has appeared in the Washington Monthly, The New Republic, and the Washington Post.
-
 Why quitting your job is so difficult in Japan
Under the Radar Reluctance to change job and rise of ‘proxy quitters’ is a reaction to Japan’s ‘rigid’ labour market – but there are signs of change
-
 Gavin Newsom and Dr. Oz feud over fraud allegations
In the Spotlight Newsom called Oz’s behavior ‘baseless and racist’
-
 ‘Admin night’: the TikTok trend turning paperwork into a party
The Explainer Grab your friends and make a night of tackling the most boring tasks
