London house prices: the boroughs rising and falling
Largest annual increases are in Croydon, while Westminster suffers ‘thumping’ drop
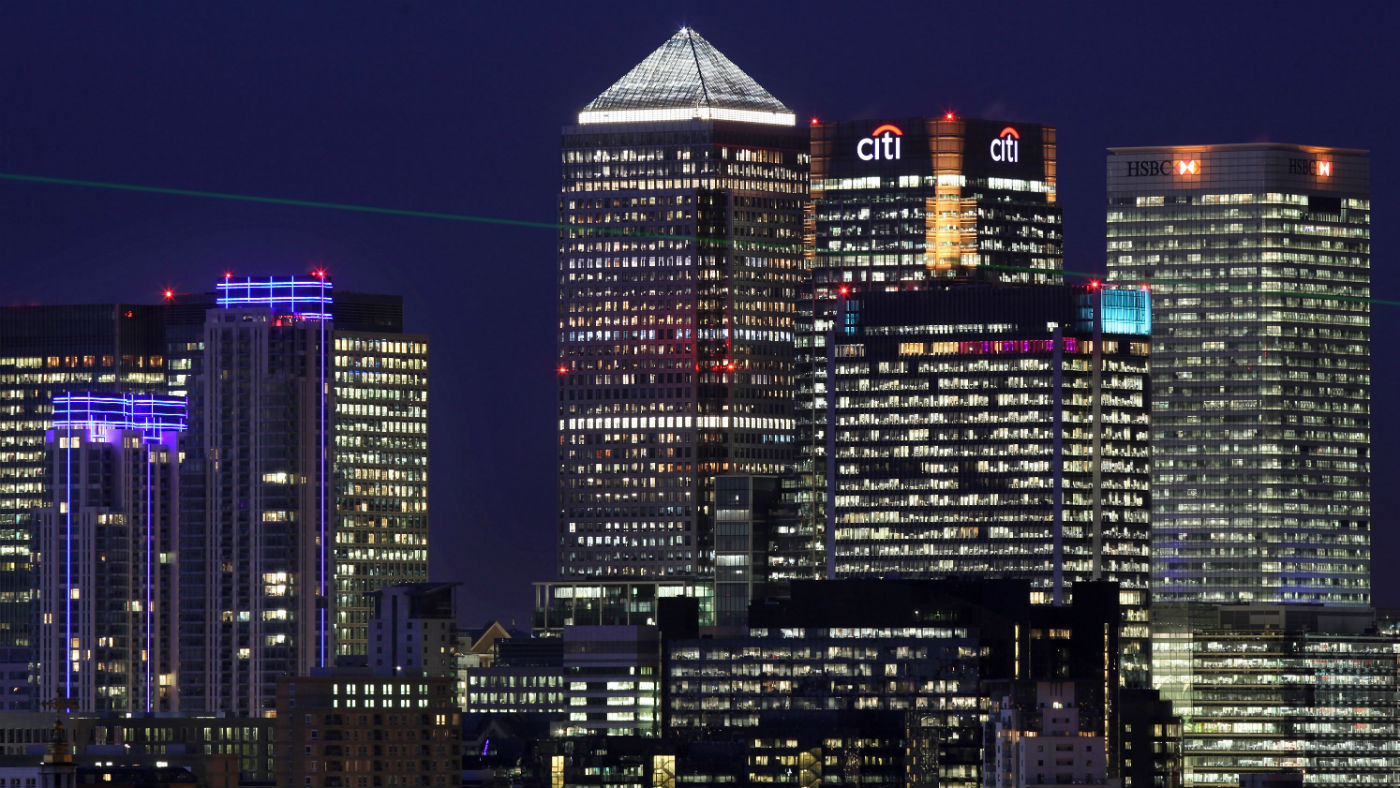
Despite fears that coronavirus would negatively impact the UK housing market, recently published figures indicate “all-time” high prices and a fast-moving market.
Data published by Rightmove shows that annual house prices are up 1.4% in Greater London, despite a reported exodus from the capital at the start of 2021.
The average property price in the capital has reached £635,306, with boroughs in the east, southeast and south of the city seeing the sharpest increases. London’s data appears to reflect a national trend for space over centrality; two and three-bedroom semi-detached houses are proving in particular demand across the UK.
The Week
Escape your echo chamber. Get the facts behind the news, plus analysis from multiple perspectives.

Sign up for The Week's Free Newsletters
From our morning news briefing to a weekly Good News Newsletter, get the best of The Week delivered directly to your inbox.
From our morning news briefing to a weekly Good News Newsletter, get the best of The Week delivered directly to your inbox.
And property is selling fast too, with 64 days now the average period to secure a buyer in the capital. Following the stamp duty holiday announcement in July 2020, the rate of sales was even faster at an average of just 48 days compared to highs of 87 and 88 days in April and May of that year.
“The stars have aligned for this spring price surge,” said Rightmove’s director of property data Tim Bannister, “with buyers’ new space requirements being part of the constellation alongside cheap mortgages, stamp duty holiday extensions in England and Wales, government support for 95% mortgages and a shortage of suitable property to buy.”
Property prices in Croydon are up 6.6% to an average £436,485. The boroughs of Barking and Dagenham, and Bexley have also seen a sharp increase of 6.1% to £456,796 and £477,277 respectively.
Westminster saw what The Sunday Times describes as a “thumping” fall of 13.2% over the 12-month period, with the average property price at £1,295,706 – the cost of “John Lewis nightmare” renovations not included. Camden and Tower Hamlets saw the next most significant decreases, with drops of 6.3% and 5.2%.
A free daily email with the biggest news stories of the day – and the best features from TheWeek.com
Despite an average price decline of 4.7%, Kensington and Chelsea remains the most expensive borough with a property likely to set buyers back an average of £1,525,989. In comparison, properties in London’s cheapest borough, Enfield, will cost buyers an average of £332,781, just above the national average of £327,797.
Here are the boroughs listed by the largest annual increases.
| Borough | Avg. price April 2021 | Monthly change | Annual change |
|---|---|---|---|
| Croydon | £436,486 | 1.9% | 6.6% |
| Barking and Dagenham | £457,796 | 1.4% | 6.1% |
| Bexley | £477,277 | 2.5% | 6.1% |
| Enfield | £332,781 | 0.9% | 4.9% |
| Redbridge | £477,839 | 2.0% | 4.6% |
| Newham | £509,835 | 3.0% | 40% |
| Havering | £577,333 | 2.0% | 3.5% |
| Hillingdon | £436,278 | 1.1% | 2.9% |
| Hackney | £642, 815 | 2.4% | 2.8% |
| Bromley | £427,030 | 1.5% | 2.8% |
| Lewisham | £490,236 | 1.3% | 2.7% |
| Harrow | £597,549 | 2.2% | 2.5% |
| Richmond upon Thames | £658,977 | 4.2% | 2.2% |
| Greenwich | £653,287 | 1.2% | 2.1% |
| Waltham Forest | £511,788 | 1.5% | 2.1% |
| Merton | £558,131 | 1.4% | 2.1% |
| Brent | £485,714 | 25% | 2.0% |
| Kingston upon Thames | £649,436 | 3.1% | 2.0% |
| Barnet | £462,483 | 1.3% | 2.0% |
| Hounslow | £874,501 | 2.0% | 1.6% |
| Ealing | £569,514 | 2.1% | 1.5% |
| Sutton | £563,822 | 2.5% | 1.4% |
| Haringey | £623,592 | 1.2% | -0.7% |
| Lambeth | £656,797 | 2.6% | -1.2% |
| Southwark | £783,593 | 1.5% | -2.3% |
| Hammersmith and Fulham | £625,167 | -0.1% | -2.4% |
| Wandsworth | £936,761 | 3.1% | -2.5% |
| Islington | £968,555 | 2.3% | -4.6% |
| Kensington and Chelsea | £1,525,989 | 0.7% | -4.7% |
| Tower Hamlets | £559,133 | 2.7% | -5.2% |
| Camden | £734,547 | -1.3% | -6.3% |
| Westminster | £1,295,706 | 1.8% | -13.2% |
-
 Trump’s Kennedy Center closure plan draws ire
Speed Read Trump said he will close the center for two years for ‘renovations’
-
 Trump's ‘weaponization czar’ demoted at DOJ
Speed Read Ed Martin lost his title as assistant attorney general
-
 Gabbard faces questions on vote raid, secret complaint
Speed Read This comes as Trump has pushed Republicans to ‘take over’ voting
-
 Sport on TV guide: Christmas 2022 and New Year listings
Speed Read Enjoy a feast of sporting action with football, darts, rugby union, racing, NFL and NBA
-
 House of the Dragon: what to expect from the Game of Thrones prequel
Speed Read Ten-part series, set 200 years before GoT, will show the incestuous decline of Targaryen
-
 One in 20 young Americans identify as trans or non-binary
Speed Read New research suggests that 44% of US adults know someone who is transgender
-
 The Turner Prize 2022: a ‘vintage’ shortlist?
Speed Read All four artists look towards ‘growth, revival and reinvention’ in their work
-
 The impact of Russia sanctions on London house prices
In Depth Oligarchs tipped to ‘flee’ the market amid plans to seize properties owned by Russians with Kremlin links
-
 UK house prices in 2022: what the experts think
feature Sellers’ market, what next and mortgage matters
-
 What’s on TV this Christmas? The best holiday television
Speed Read From films and documentaries to musicals for all the family
-
 Coco vision: up close to Chanel opticals
Speed Read Parisian luxury house adds opticals to digital offering