The unemployment rate is higher than it should be — and that might be a good thing
A new way of looking at the economic data suggests reasons for hope


A free daily email with the biggest news stories of the day – and the best features from TheWeek.com
You are now subscribed
Your newsletter sign-up was successful
Prepare yourselves, readers. We're going to get wonky today.
Last week the government released the latest data in the Job Openings and Labor Turnover Survey (JOLTS). It allows us to see how trends like job openings, job seekers, layoffs, hires, and voluntary quits are behaving, thus providing a more informative picture of how and where the economy is recovering. (Or not.)
The most interesting thing the JOLTS data helps with is something called the Beveridge Curve. You get it by plotting the unemployment rate on your horizontal axis and the job openings rate on your vertical axis. Then you find the point where those two measures intersect, and you watch how that point travels over time — because the shape of the path it cuts can tell you useful things about the economy.
The Week
Escape your echo chamber. Get the facts behind the news, plus analysis from multiple perspectives.

Sign up for The Week's Free Newsletters
From our morning news briefing to a weekly Good News Newsletter, get the best of The Week delivered directly to your inbox.
From our morning news briefing to a weekly Good News Newsletter, get the best of The Week delivered directly to your inbox.
Here's the Beveridge Curve going back to December 2000, which is as far back as the JOLTS data goes:
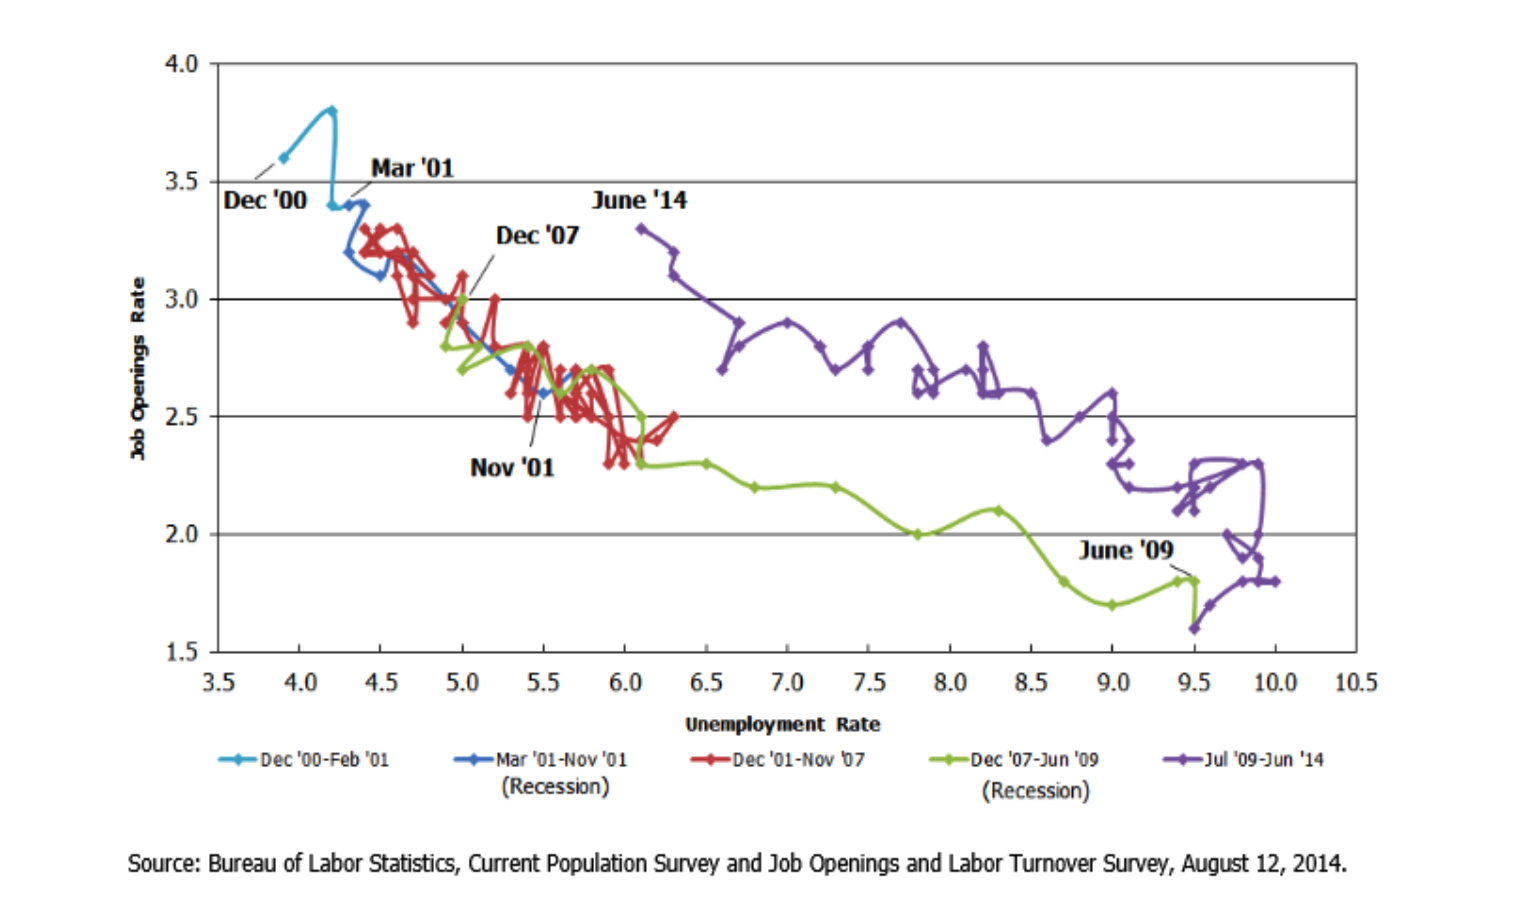
(Shifts in the Beveridge Curve)
The portion that is blue then red shows how the curve traveled in the 2001 recession and the ensuing recovery. It backtracked on top of itself, and economists have generally taken that as a good sign: The relationship between job openings and the unemployment rate remained stable. Things returned to normal.
Now look at the green portion, which tracks the aftermath of the 2008 recession, and the purple portion, which begins in 2009 and tracks the ongoing recovery. When it swings back around, the curve shifts upward; now we have a higher unemployment rate at any particular job openings rate than we did before. Economists have generally assumed this is bad, and that it suggests unemployment has become "structural" — i.e. the nature of the economy has changed in some basic way that makes higher unemployment the norm.
A free daily email with the biggest news stories of the day – and the best features from TheWeek.com
But should they assume that?
On Monday, Nick Bunker, a policy analyst at the Washington Center for Equitable Growth, pointed to a study from last year in which the researchers used other data sources to rebuild the JOLTS job opening numbers going all the way back to 1951. What they found was that in the nine recessions in that period, the 2001 slump was the only one where the Beveridge Curve didn't shift. In all the others, including 2008, it moved outward. And yet, in several of those recoveries, the unemployment rate was able to get lower than it was at the previous peak of the business cycle.
So maybe that outward shift in the Beveridge Curve isn't a bad sign after all. In fact, maybe it's 2001 that's bad. Because that recession actually marked a rather disturbing turning point in the U.S. economy.
In many of those other recessions going back to 1951, the U.S. economy was able to get back to full employment. Since 1980, though, it hasn't managed to do that save for the brief economic boom in the late 1990s. All recessions throw people out of work, but the hole the 2001 recession blew in American employment still hadn't been filled in when the 2008 collapse drove it much deeper.
You can see that in the civilian labor force participation rate, which is the percentage of Americans over age 16 who are both employed and unemployed but still actively looking for a job.
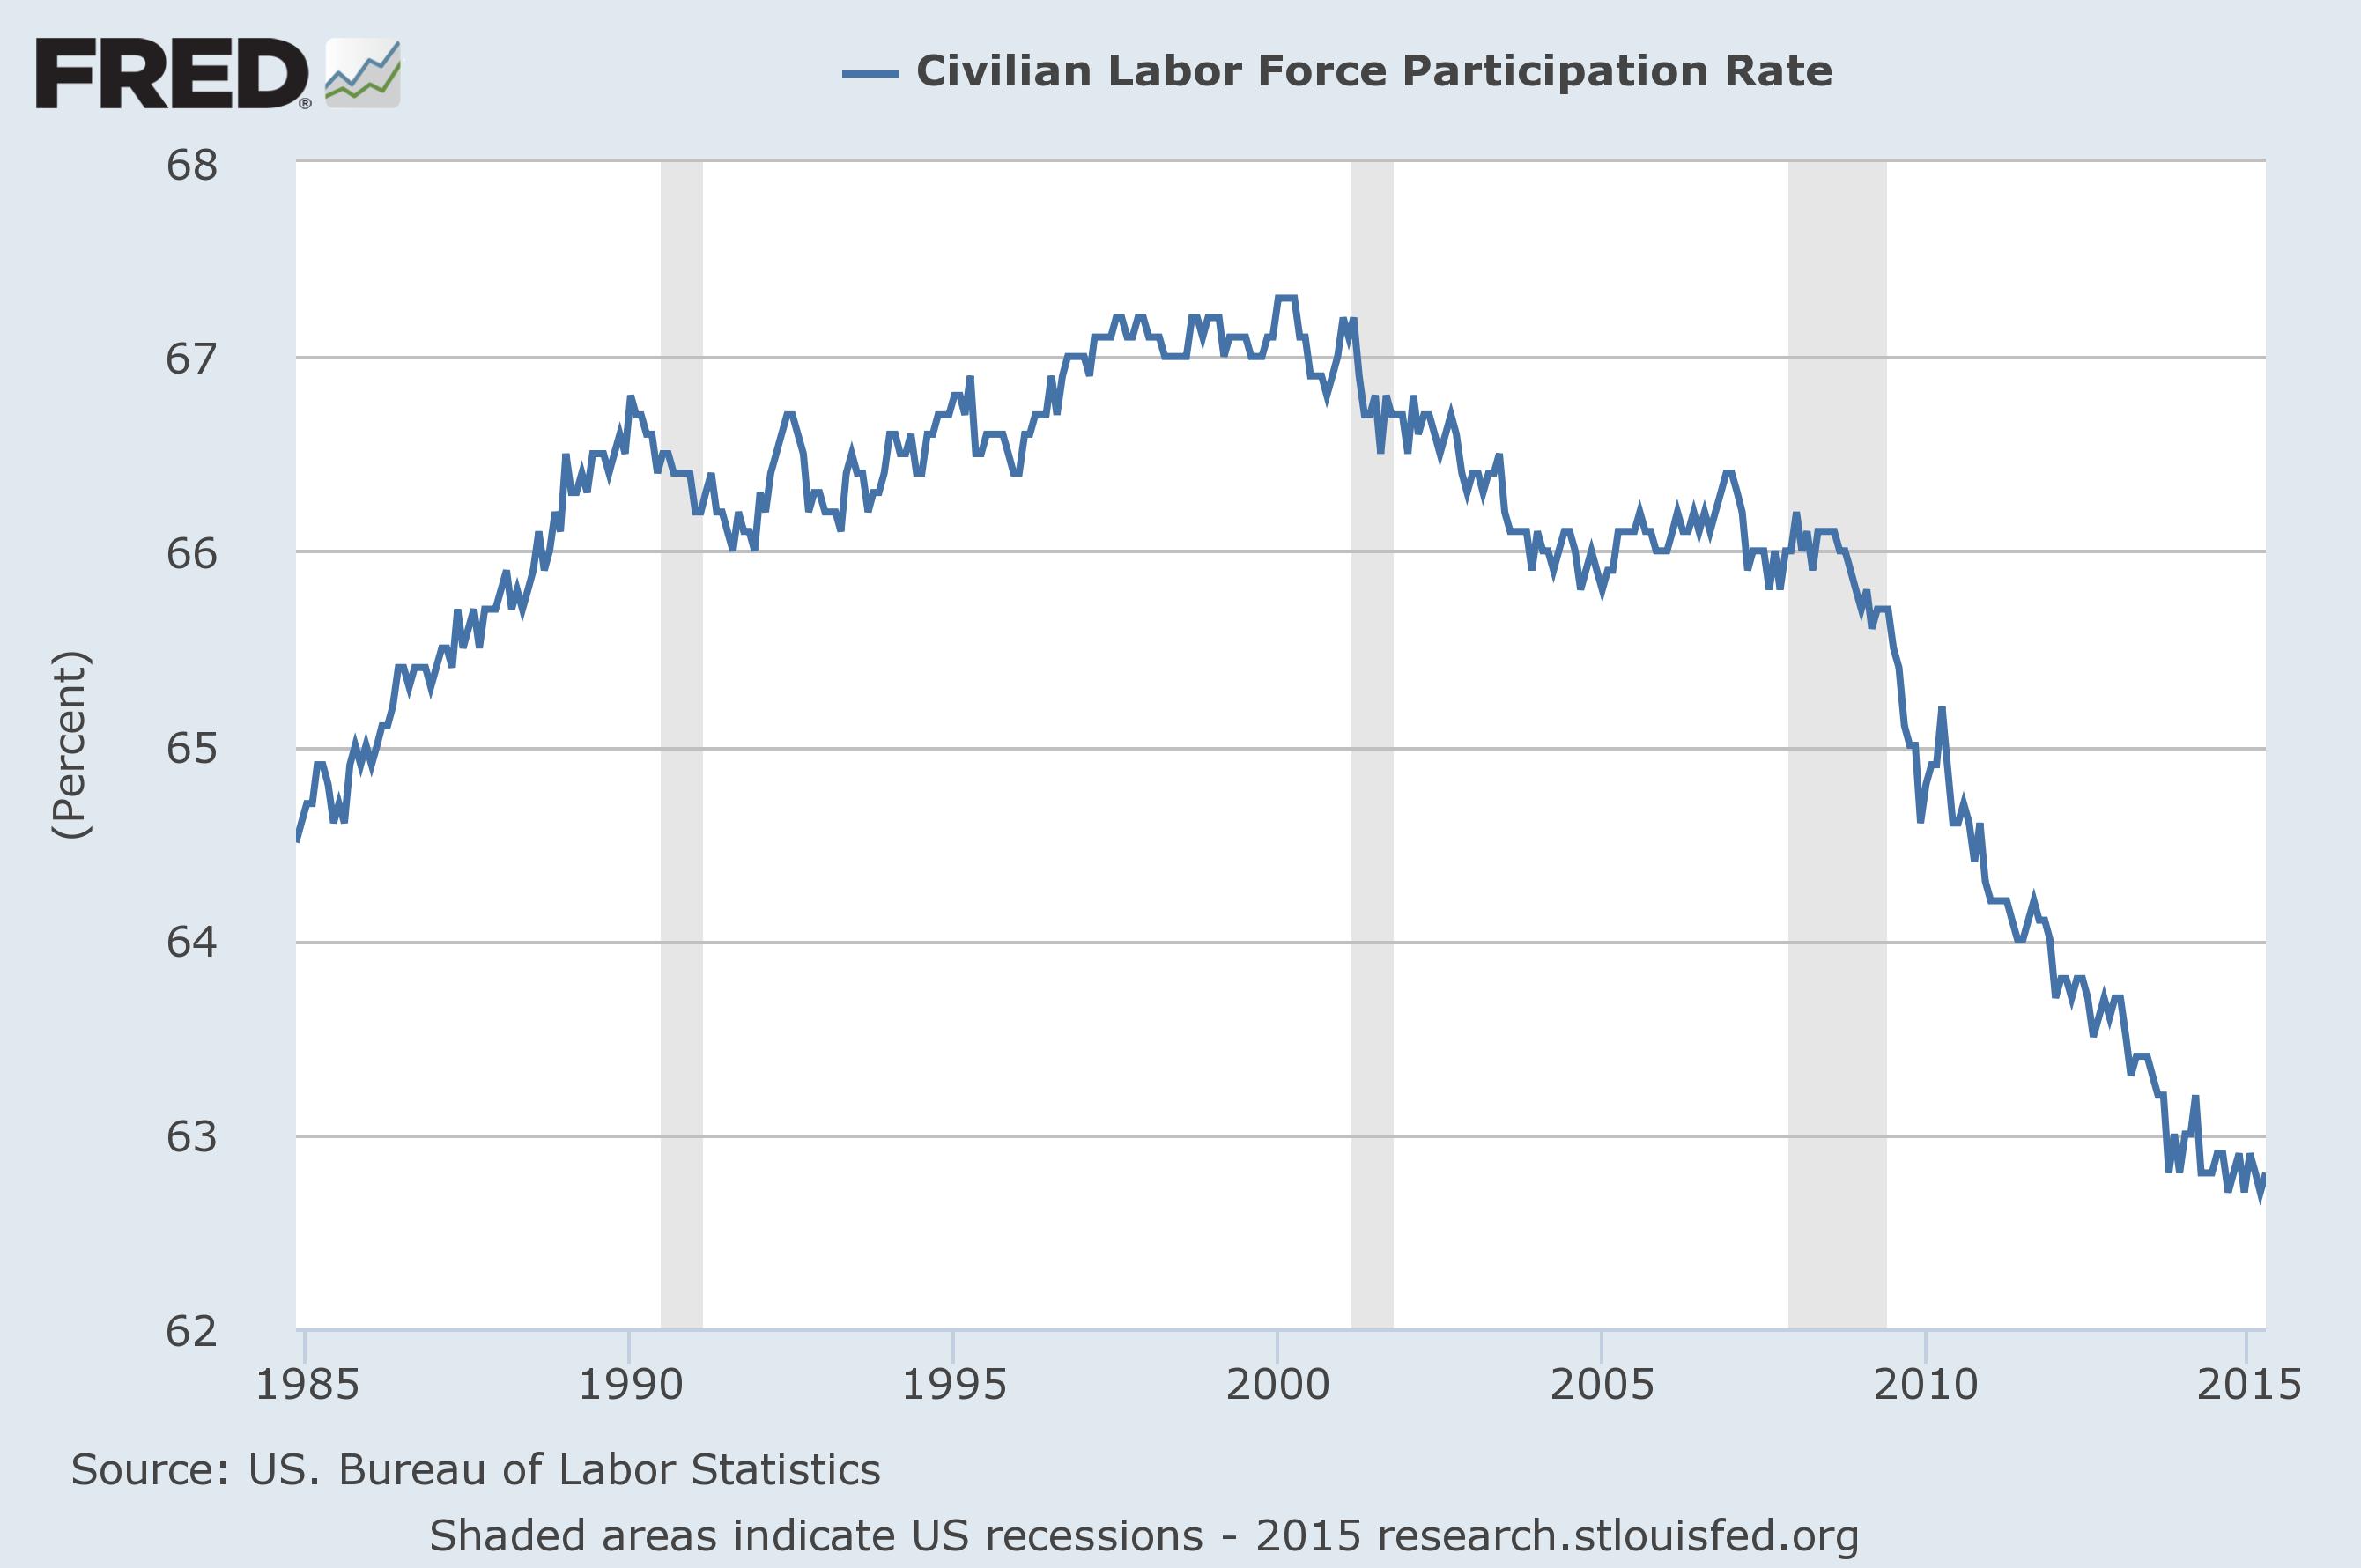
(Federal Reserve Bank of St. Louis)
Labor force participation saw a big one-time increase in the '60s and '70s thanks to the entrance of women into the working world. So it can be a little hard to tease out just what the "new normal" should be. But as you can see, it dropped after the 2001 recession, then stabilized at that lower level, then just plummeted after 2008.
Why is all this important? Because the unemployment rate — part of what the Beveridge Curve tracks — isn't the percentage of all Americans who are unemployed. It's the percentage of the labor force that's unemployed. And if you've given up on looking for work, you aren't counted in the labor force. The unemployment rate may be dropping, but it's dropping as a percentage of a much smaller labor force than it was before.
Here's the last piece of the puzzle. In his post, Bunker noted that if you split the unemployment rate up into regular unemployment and long-term unemployment, the Beveridge Curve post-2008 using just the regular rate looks just like the post-2001 situation. The outward shift is entirely the result of the long-term unemployment rate, which has been huge in this recession.
But one big reason the long-term unemployment rate may be higher is because the U.S. government went out of its way to bulk up and extend the length of unemployment benefits this time around. This has angered conservatives, who regularly insist that the longer and more generous benefits have kept the U.S. unemployment rate higher than it otherwise would be. But if it keeps the unemployment rate higher, it does so because it keeps people looking for work, and thus keeps the size of the labor force larger.
Put it all together, and it might be the case that the 2001 Beveridge Curve was the result of a wounded labor force. It was rendered smaller by the slump, so the unemployment rate was lower, and thus it was easier for the curve to shift back on top of itself in the context of that recession. Conversely, while the 2008 slump was so much worse, the U.S. government also arguably responded to it with much more aggressive policy, in terms of extending unemployment insurance as well as fiscal and monetary stimulus.
So the post-2008 Beveridge Curve may be a sign that — in defiance of what the above graph suggests — we've actually kept more people in the labor force and looking for work, even if they're unemployed, than if we'd simply stuck with the policy status quo. Things could have been a lot worse.
So maybe there's some reason for hope. The labor force participation rate may be way down, but the prime-age employment ratio is already recovering, which suggests a lot of the loss in the labor force was people retiring or staying in school longer. And at least the second one is a temporary state of affairs.
Which means, with the right policy mix — i.e. a bigger and more helpful safety net — at least some portion of the hole that still remains in American employment could be repaired.
Jeff Spross was the economics and business correspondent at TheWeek.com. He was previously a reporter at ThinkProgress.
-
 Film reviews: ‘Send Help’ and ‘Private Life’
Feature An office doormat is stranded alone with her awful boss and a frazzled therapist turns amateur murder investigator
-
 Movies to watch in February
the week recommends Time travelers, multiverse hoppers and an Iraqi parable highlight this month’s offerings during the depths of winter
-
 ICE’s facial scanning is the tip of the surveillance iceberg
IN THE SPOTLIGHT Federal troops are increasingly turning to high-tech tracking tools that push the boundaries of personal privacy
