Why the shape of inequality matters
If you really want to understand inequality, don't just look at the rich. Look at the very richest.

If you're looking for a glimpse into a completely different universe, go read this article in The New York Times. It's not science fiction. Rather, it's the economic, legal, and political landscape occupied by the richest of the richest: the top 400 earners in the country.
This is an intensely rarified community, where the income threshold for entrance is roughly $100 million annually. The article digs into an entire industry of lawyers, accountants, and lobbyists that has grown up around this small population, devoted to altering tax policy, exploiting byzantine loopholes, and negotiating with the Internal Revenue Service (IRS) on behalf of their clients, creating what amounts to a parallel tax system for the super wealthy. As a result, over the last two decades, the portion of their income those 400 pay in taxes dropped from 27 percent to 17 percent — just a hair higher than what families making $100,000 pay.
But I don't want to get too far into the arcane details of tax policy. What I want to focus on is the immense power the super wealthy have accumulated, and why what you might call the "shape" of economic inequality matters so much.
The Week
Escape your echo chamber. Get the facts behind the news, plus analysis from multiple perspectives.
Sign up for The Week's Free Newsletters
From our morning news briefing to a weekly Good News Newsletter, get the best of The Week delivered directly to your inbox.
From our morning news briefing to a weekly Good News Newsletter, get the best of The Week delivered directly to your inbox.
Most Americans don't realize how extreme the distribution has become at the very high end. It can be difficult to wrap your brain around. Here's a graph Catherine Rampell put together, based on numbers from 2011:
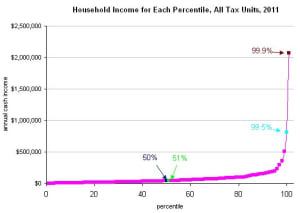
(Graph courtesy of Catherine Rampell at the New York Times. Data from the Tax Policy Center.)
The horizontal axis is percentiles of income. So if your household is at 50 percent, half the country makes more than you. If you're at 80 percent, only 20 percent makes more than you, and so on.
Now, you'd need to make $19,375 a year to hit 25 percent in 2011, and $42,327 to hit 50 percent. That's a difference of $22,952. But the difference between 50 percent and 95 percent is over $150,000. The difference between 95 percent and 99 percent is over $300,000. From 99 percent to 99.5 is another $300,000, and then up to 99.9 percent is more than $1 million — which is where the graph tops out. The more finely you slice the tippy top, the more vast the distances between incomes become.
A free daily email with the biggest news stories of the day – and the best features from TheWeek.com
But we haven't even gotten truly vertiginous yet.
The 99.9 percent is made up of 160,400 households, each bringing in at least $6,234,800 in 2011. If we wanted to keep drawing our graph until we hit that marker, we'd have to more than double the height of the vertical axis.
But to reach the $100 million threshold of the top 400? The vertical axis would have to be 40 times higher than it is.
It was not always this way. Back in 1960, the income threshold for those at 99.99 percent was merely $958,428 after adjusting for inflation. That's about where the 99.5 percent are now in the graph above.
Now, a lot of politicians and commentators in America tend to scoff at these sorts of concerns, figuring worries about inequality are based purely in aesthetics or envy. But this massive increase in the distance between the 99 percent, the 99.9 percent, the 99.99 percent and so on has very concrete consequences.
For instance, raising those income thresholds required basically redistributing money to the very wealthy. In 1970, one-tenth of all income generated in the American economy went to the top 1 percent. (Those at 99 percent in the graph above.) Today, that share has doubled to one-fifth. In other words, if inequality had not changed its shape since the 1970s, 10 percent more of all income in the economy would be going to the bottom 99 percent of Americans. That's an extra $4,762 for every man, woman, and child in the bottom 99 percent, every year.
Next, because what businesses charge for goods and services is influenced by what people can pay, this massive rise in the upper ceiling of the income distribution boosts prices for things like housing and education and so forth, with ripple effects for everyone lower down. So inequality shapes where aggregate demand clusters and where it doesn't, and thus where job creation is robust and where it's not.
Moving away from raw dollars, the shape of inequality also means the wealthy exert a unique gravitational pull across all areas of society. The Times article is a good example. Because of their outsized purchasing power — they "literally pay millions of dollars for these services," a political scientist told the Times, "and save in the tens or hundreds of millions in taxes" — these 400 people are able to hire all that lobbying and legal talent to design them a friendlier tax code. In a different world, where income distribution was much more equal, those same people could have been hired to fight pollution, investigate corporate malfeasance, or design a more just tax system for the poor.
This logic extends out much further, too: It's the small community in the top percentiles of Americans who mostly set corporate policies for the companies where many Americans work; who decide where jobs will be created and where they'll move; who determine what institutions and causes will receive the millions they donate, and so on. They shape think tank priorities and concerns, and what questions academia does and does not ask.
Then there's politics: As Jared Bernstein, a senior fellow at the left-leaning Center on Budget and Policy Priorities, told the Times, the wealthy "can buy policy, and specifically, tax policy." And it's much more subtle than brute campaign donations. The richest Americans have much more personal contact with lawmakers, and often run in the same social circles, wielding all the cultural weight and influence their unique wealth affords them. So their preferences for smaller deficits, a smaller welfare state, fewer unions, lower or no minimum wages, and a government that doesn't bother with providing enough jobs or the necessities of life exert an enormous sway on policymaking, even when most voters disagree with them. And that's true at the local and state level as well.
The key thing to realize is that so much of this is purely positional: The relative distances between the 99 percent, the 99.9 percent, and on up are precisely what matter. The wealthy have this power not because of how much they have, but because of how much more they have. The more you can out-bid everyone else in terms of money, clout and standing, the more you can direct the economy, politics, and society.
The challenge of moving back to a more equitable society isn't insurmountable: changes pushed through by Obama and the Democrats since 2012 have pushed the tax rate for the 400 wealthiest back up, for instance. But it remains enormous.
Jeff Spross was the economics and business correspondent at TheWeek.com. He was previously a reporter at ThinkProgress.
-
 Trump’s ‘Board of Peace’ comes into confounding focus
In the Spotlight What began as a plan to redevelop the Gaza Strip is quickly emerging as a new lever of global power for a president intent on upending the standing world order
-
 ‘It’s good for the animals, their humans — and the veterinarians themselves’
Instant Opinion Opinion, comment and editorials of the day
-
 The world is entering an era of ‘water bankruptcy’
The explainer Water might soon be more valuable than gold
-
 The pros and cons of noncompete agreements
The Explainer The FTC wants to ban companies from binding their employees with noncompete agreements. Who would this benefit, and who would it hurt?
-
 What experts are saying about the economy's surprise contraction
The Explainer The sharpest opinions on the debate from around the web
-
 The death of cities was greatly exaggerated
The Explainer Why the pandemic predictions about urban flight were wrong
-
 The housing crisis is here
The Explainer As the pandemic takes its toll, renters face eviction even as buyers are bidding higher
-
 How to be an ally to marginalized coworkers
The Explainer Show up for your colleagues by showing that you see them and their struggles
-
 What the stock market knows
The Explainer Publicly traded companies are going to wallop small businesses
-
 Can the government save small businesses?
The Explainer Many are fighting for a fair share of the coronavirus rescue package
-
 How the oil crash could turn into a much bigger economic shock
The Explainer This could be a huge problem for the entire economy
