The unexpected truth about Americans' work hours
A new study blows some big holes in many long-held assumptions


Work hours in America are oddly distributed. Speaking very broadly, white people work longer than people of color, men work longer than women, and people with advanced educations work longer than those without. That's led to a lot of commonly peddled narratives about the overworked professional class, or insufficient work ethic among lower classes.
This is mostly nonsense. And a new study shows us exactly why.
Valerie Wilson and Janelle Jones of the Economic Policy Institute just released a big new dive into work hours. They focused on Americans in their prime work years, ages 25 to 54. They sliced the data by race, gender, and education, as well as by hours worked per week and weeks worked per year.
The Week
Escape your echo chamber. Get the facts behind the news, plus analysis from multiple perspectives.

Sign up for The Week's Free Newsletters
From our morning news briefing to a weekly Good News Newsletter, get the best of The Week delivered directly to your inbox.
From our morning news briefing to a weekly Good News Newsletter, get the best of The Week delivered directly to your inbox.
But the big takeaway came when Wilson and Jones separated out people who earned any income at all in a given year from those who earned nothing.
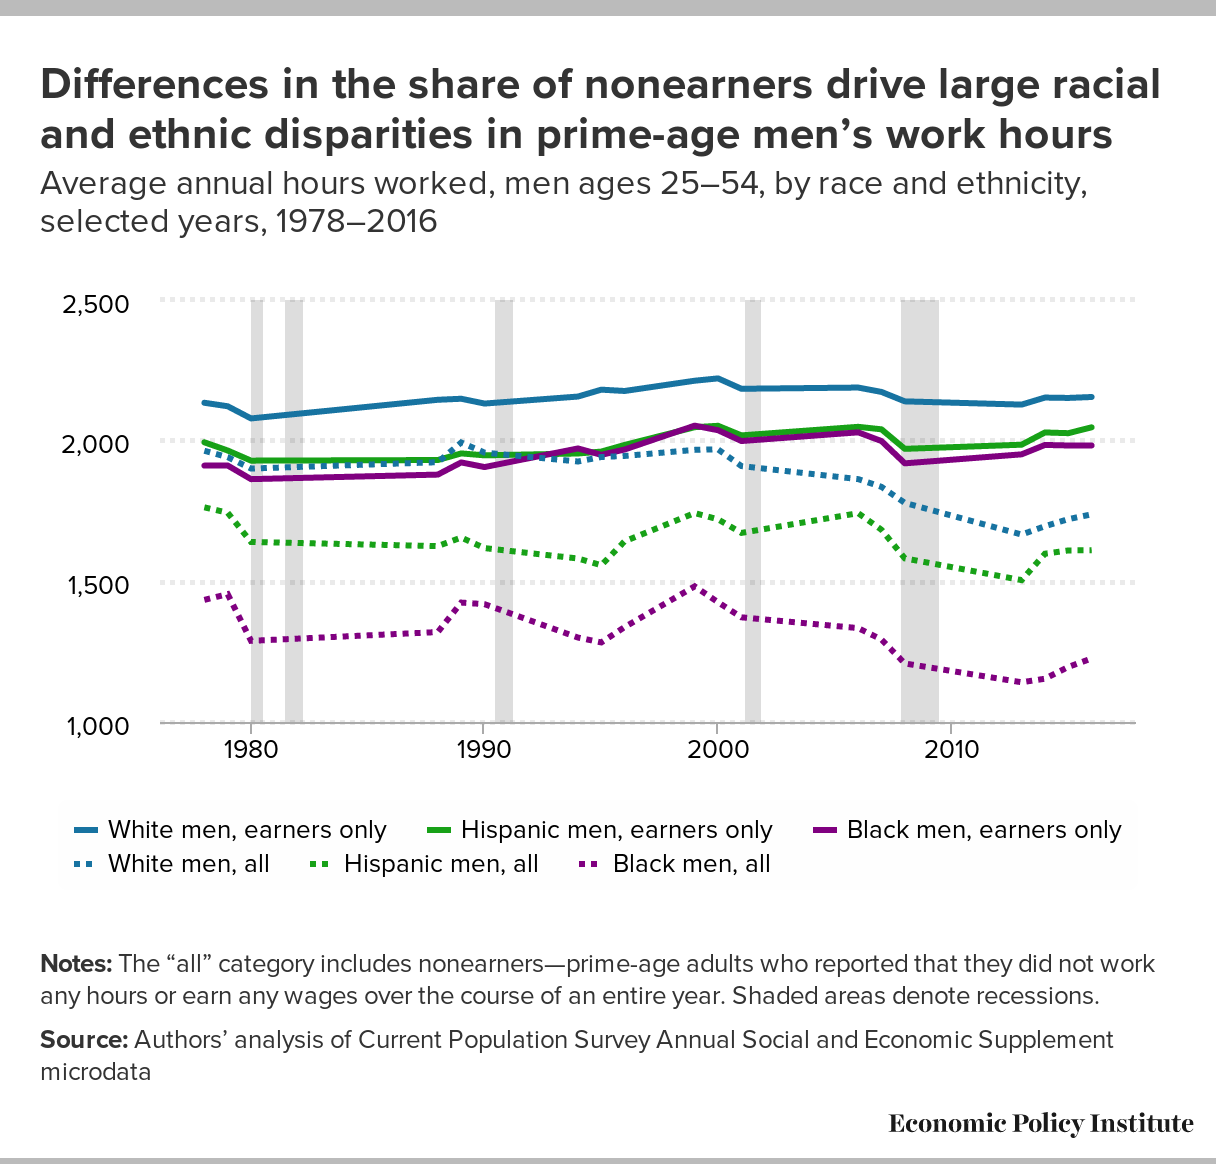
To see why, look at the graph below, which covers men. Among all prime-age men (the dotted lines) the gaps in work hours are huge. But if you just focus on men who earned income (the solid lines) the gaps collapse. White male earners worked 2,155 hours in 2016, Hispanic male earners worked 2,047 hours, and black male earners worked 1,983. All three come very close to 40 hours a week: 41.5 hours, 39.4 hours, and 38.1 hours, respectively. And those numbers didn't change much for the previous three-and-a-half decades.
What does this tell us? The big gaps in work hours between all white prime-age men and all black prime-age men, for instance, are driven by black men who don't work at all in a given year. A lot more zeroes drag down the overall average.
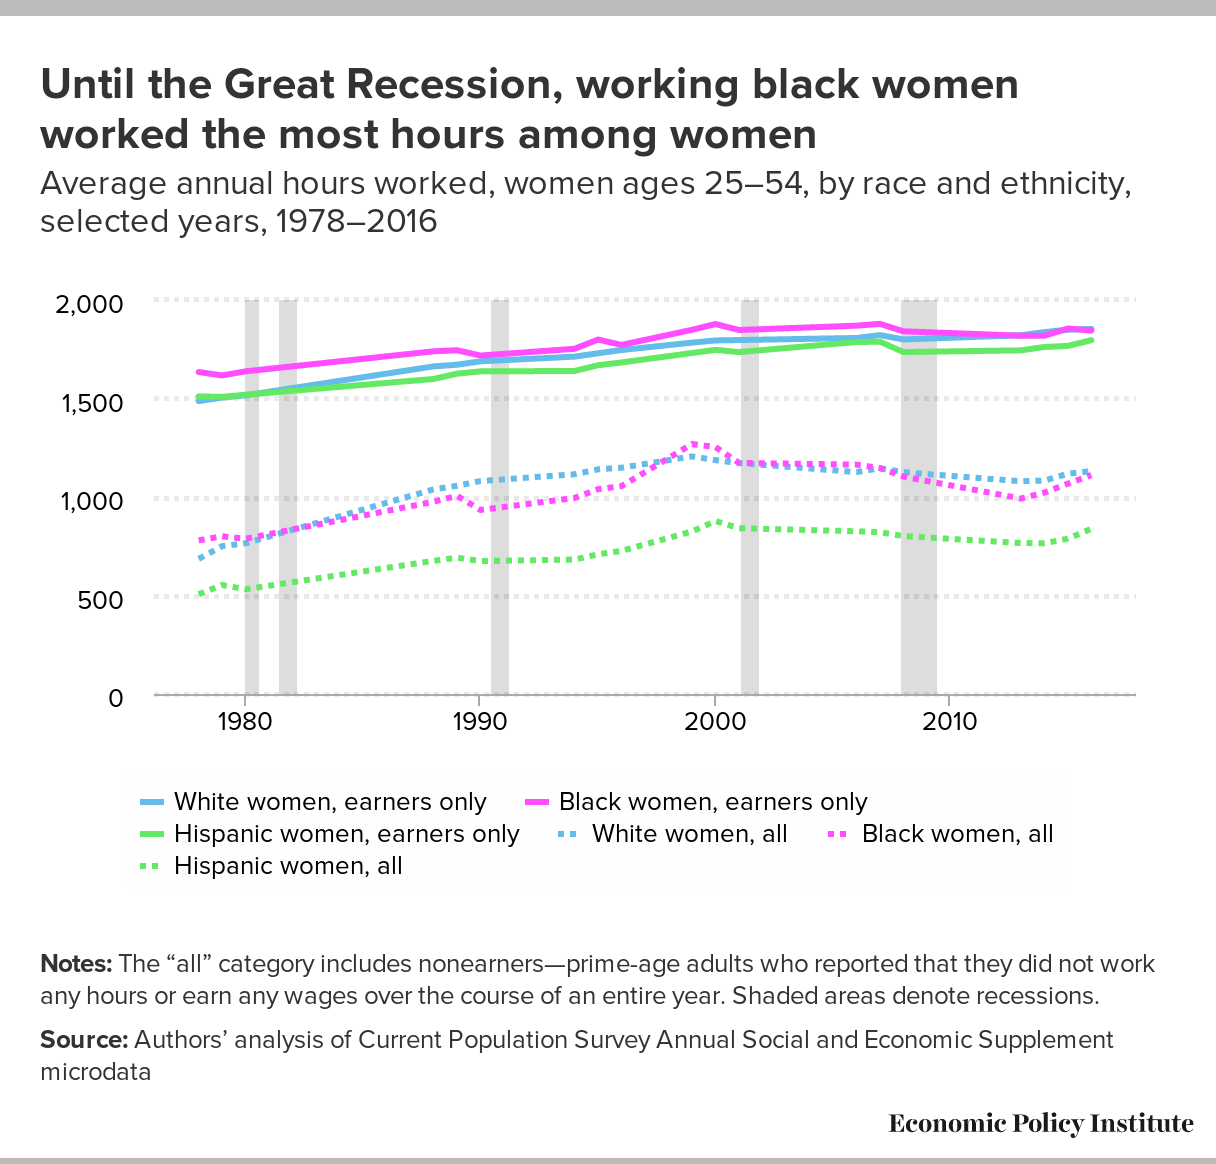
The story is very much the same for women. Overall, prime-age women who have earned any money put in fewer hours than equivalent men. But they've been closing the gap. Also interesting is that non-earners drag down the averages for black and white women about equally, but more so for Hispanic women.
A free daily email with the biggest news stories of the day – and the best features from TheWeek.com
Wilson told The Week that she and Jones examined education as well, but didn't include it for simplicity's sake. Annual hours for college-educated men were 2,161 versus 1,943 for men with less than a high school degree. (Or 41.6 hours a week versus 37.4 hours a week.) For women, it was 1,903 versus 1,572, respectively — a substantially bigger gap.
The other big takeaway you may have spotted in those graphs is this: After 2000, hours worked by all prime-age men suddenly fell dramatically, even as hours for for prime-age men who earned anything held relatively steady. (The same thing happened to women, but less dramatically.) The number of men who weren't working at all — and thus dragging down the overall averages for hours — shot up after the 2001 recession and the Great Recession.
Part-time employment obviously still plays a role in the economy. But the "gig economy" or the "1099 economy" are probably best understood as more workers having to cobble together multiple jobs to get something close to full hours. The portion of the population that's working significantly fewer than 40 hours total, but is still working, actually isn't that large. When it comes to work hours, it's more of an all-or-nothing split. And a lot more people, especially men, have fallen into the "nothing" camp since 2000.
"The real dividing factor, increasingly, is whether or not you're attached [to the workforce] at all," Wilson said.
And what of those who aren't attached?
Among working-age men, the main reasons for unemployment are involuntary: illness, disability, or not enough jobs to be found. The overall portion of jobless black men is significantly larger than for white men. Interestingly though, Wilson and Jones' data shows that the percentages of the jobless citing each reason are roughly the same for both racial groups.
Conservatives are leery that increasing disability benefit payments mean more people are scamming the system to avoid work. But analysis of the numbers says otherwise: Raw demographics account for a lot of the change. Big state-level cuts to workers' compensation programs mean more people with legitimate problems have to rely on disability payments instead. There's also the opioid crisis to contend with. Finally, disability can't really be separated from the job market itself: If opportunities are abundant, people with a back injury or an anxiety disorder are more likely to find an employer that's able or willing to work around those challenges. When jobs are scarce and bosses can be picky, disability is a much higher barrier.
Ultimately, the number of jobs and job hours available in the economy is a function of aggregate demand. And that's a function of recessions, recoveries, and national economic policy — as opposed to individual discipline or work ethic.
Not surprisingly, white and Hispanic working-age women who don't have jobs cite caring for the home and family much more often. The big glaring exception, though, is black women: Their reasons for not working, and the distribution of those reasons, looks far more similar to men. "Economic historian Nina Banks has written a lot about this," Wilson explained. "Historically it's been the case that black women have had stronger labor market attachments, and haven't really been offered the privilege or opportunity to be out of work."
One other tidbit from Wilson and Jones' data worth noting: From 1979 to 2016, people who earned any income in a given year actually increased their annual work hours: from 1,817 hours to 1,977. Breaking it down by gender, prime-age earning women increased their hours from 1,518 to 1,841. That didn't reach the same heights as men, who increased from 2,086 to 2,105. But the size of women's increase was much bigger: 7.6 percent versus 2.2 percent. Similarly, black male prime-age earners increased their hours 3.7 percent, versus just 1.6 percent for white men.
Across the board, the lowest earning prime-age workers added additional hours the most over this time period. As Wilson and Jones put it, this "challenges the notion that a lack of effort or personal responsibility is to blame for low-income status and persistent racial disparities in earnings."
There's an alternative explanation: Rising pay per hour accounted for 88 percent of the growth in earnings for the top fifth of earners from 1979 to 2016. But for everyone else, 75 percent of their pay growth came from working more hours. In short, wage stagnation forced Americans to load up on even more hours to stay afloat.
Yet there aren't enough hours to go around. And the shortfall has gotten worse since 2000.
Jeff Spross was the economics and business correspondent at TheWeek.com. He was previously a reporter at ThinkProgress.
-
 31 political cartoons for January 2026
Cartoons Editorial cartoonists take on Donald Trump, ICE, the World Economic Forum in Davos, Greenland and more
-
 Political cartoons for January 31
Cartoons Saturday's political cartoons include congressional spin, Obamacare subsidies, and more
-
 Syria’s Kurds: abandoned by their US ally
Talking Point Ahmed al-Sharaa’s lightning offensive against Syrian Kurdistan belies his promise to respect the country’s ethnic minorities
-
 The pros and cons of noncompete agreements
The Explainer The FTC wants to ban companies from binding their employees with noncompete agreements. Who would this benefit, and who would it hurt?
-
 What experts are saying about the economy's surprise contraction
The Explainer The sharpest opinions on the debate from around the web
-
 The death of cities was greatly exaggerated
The Explainer Why the pandemic predictions about urban flight were wrong
-
 The housing crisis is here
The Explainer As the pandemic takes its toll, renters face eviction even as buyers are bidding higher
-
 How to be an ally to marginalized coworkers
The Explainer Show up for your colleagues by showing that you see them and their struggles
-
 What the stock market knows
The Explainer Publicly traded companies are going to wallop small businesses
-
 Can the government save small businesses?
The Explainer Many are fighting for a fair share of the coronavirus rescue package
-
 How the oil crash could turn into a much bigger economic shock
The Explainer This could be a huge problem for the entire economy
