Sign up for The Week’s free daily newsletter, Today’s Best Articles
Join 350,000+ subscribers and keep yourself informed with a selection of
The Week’s most interesting, enlightening and entertaining stories - plus daily puzzles.
You are now subscribed
Your newsletter sign-up was successful
Want to add more newsletters?
An account already exists for this email address, please log in.
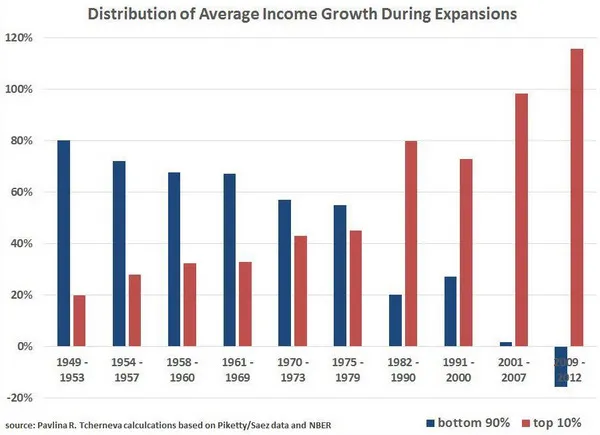
How the rich devoured the American economy, in one chart
In America, a rising economic tide lifts all boats, right? Not anymore. Pavlina Tcherneva, an economist at Bard College, plotted the distribution of income growth between the bottom 90 percent and the top 10 percent during economic expansions in the United States. The red bars are the richest 10 percent of people, the blue bars are everyone else:
Now, this is only economic expansions, which explains the wonky interval choices at the bottom — 1974 is missing, for example, because that whole year was taken up by recession. Those recessions would also probably claw back some of the rich's income gains, since they get a lot of income from financial assets which crash in price during recessions (see p. 8 here).
But the trend here is undeniable. Economic expansions are supposed to be when the American economy distributes the fruits of growth to everyone. And that used to be true! But slowly and steadily the rich have gained on everyone else. They advance almost regardless of which party is in control of government — Reagan speeds it up, while Clinton slows it down, but not by very much.
The Week
Escape your echo chamber. Get the facts behind the news, plus analysis from multiple perspectives.
Most staggering of all, during our current economic expansion, the bottom 90 percent is posting an average income decline. Not only is the rising tide not lifting everyone equally, it's actually distributing less than nothing to nine-tenths of the population, on average.
Sign up for The Week’s free daily newsletter, Today’s Best Articles
Join 350,000+ subscribers and keep yourself informed with a selection of
The Week’s most interesting, enlightening and entertaining stories - plus daily puzzles.