The case for more tax brackets
Want a better tax system? Look to 1960.


These days, it's not long before any discussion of tax policy gets into simplifying the tax code. And on the Republican side, it's not long before discussions of simplification veer into reducing the number of tax brackets. There are currently seven of them. As Alvin Chang observed at Vox, Donald Trump, Chris Christie, and Jeb Bush each want to cut it down to three brackets. Marco Rubio wants two brackets, and Ted Cruz, Ben Carson, and Rand Paul all want one flat rate for everyone.
The "simplicity" argument for fewer brackets is flawed on its own terms. Figuring out what bracket your income falls into takes five minutes of paperwork and some high school arithmetic. The crushing complexity of the tax code comes before that step, when you have to actually define your income — that's when the avalanche of loopholes, deductions, credits, and carve-outs piles atop you. Brackets aren't the problem. Indeed, as Chang showed with a very slick interactive graphic, for the vast majority of the 20th century, the U.S. income tax code featured way more brackets than it does now.
But the historical record suggests something even more pointed: Not just that having lots of tax brackets isn't bad, but that having lots of them is a positive good.
The Week
Escape your echo chamber. Get the facts behind the news, plus analysis from multiple perspectives.

Sign up for The Week's Free Newsletters
From our morning news briefing to a weekly Good News Newsletter, get the best of The Week delivered directly to your inbox.
From our morning news briefing to a weekly Good News Newsletter, get the best of The Week delivered directly to your inbox.
Let's take 1960 as a benchmark. There were 26 tax brackets that year, which is a rough median: At various points in the 1920s and '30s there were more than 50 brackets, and the big drawdown in brackets didn't begin until around 1965, when there were 33 brackets. That drawdown ended in the late 1980s, with two brackets, which were then modestly expanded back to five brackets, and then seven a few years later.
1960 also sits in the middle of the mid-century period when U.S. income inequality was at its lowest:

(Graph courtesy of Striking it Richer: The Evolution of Top Incomes in the United States (Updated with 2011 estimates) by Emmanuel Saez, Jan. 23, 2013. Income is defined as market income including capital gains.)
So what do the brackets have to do with all this? Well, it's not just that there were 26 brackets. It's how they were laid out.
In 2013 dollars, the lowest tax bracket for a married household filing jointly went from $0 to $31,026, and you paid a tax rate of 20 percent on that income. The next bracket went from $31,026 to $62,052, and people paid 22 percent on that income. (This is how brackets work: You pay the percentage rate just on the income that falls within that bracket's range.) That pattern of a modest step-up in the tax rate every $31,000 or so kept going until you hit $341,288 in the 13th bracket. After that, the range of income covered by each bracket increased more quickly, and the rates went up slightly faster as well. By the 17th bracket, you were paying a 75 percent tax rate on every dollar between $775,655 and $930,786. By the time you cleared $1 million, you were losing over 80 percent of every dollar. And once you cleared $2 million you were losing 90 percent or more.
The higher number of brackets actually allowed the income tax rate to operate along a slope: relatively low for the incomes of most ordinary Americans, picking up considerably for higher incomes, and leveling out at over 90 percent.

(Graph by author. Data courtesy of the Tax Foundation.)
The contrast with today is striking: We have just seven brackets, and in 2013 the highest one imposed a rate of just 40 percent on the money made by any married household over $450,000. (The cutoffs for the brackets change every year.) So every household, no matter how high their income goes, pays a top marginal income tax rate of 40 percent.
To be in the top 10 percent of earners in 2013, a married household needed to be making a bit less than $200,000 a year or more. To be in the top one percent, they needed to be earning around $400,000. And within the top one percent, the incomes keep increasing at remarkable rates: many millions of dollars for the top 0.1 percent, and many tens of millions for the top 0.01 percent.
So if we had 1960's tax bracket structure in 2013, the money that gets households into the top 10 percent would be taxed at around 47 percent, not 33 percent. The money to get into the top one percent would be taxed at over 60 percent. And in the upper echelons of the top one percent, there really wouldn't be any point to earning the money in that bracket at all.
According to the center-right's conventional wisdom, these sorts of tax rates are terrible for growth, because they discourage worker productivity. But GDP growth and job growth occurred at noticeably faster paces before tax brackets and rates were drawn way down between 1970 and 1980.
Moreover, every company has to decide what to do with its revenue, and how to divide it among its workers. There's no point to paying the CEO and top management many millions if the government will just take it all. And it wasn't just the income tax that was damming up the flow of money to the top: Capital gains taxes were higher too, as was the corporate income tax. But that flow of money through companies doesn't just disappear. It still has to go somewhere. And the massive compression in inequality we saw circa 1960 suggests that where the money went was back down the income ladder.
This isn't a question of government taxing more and then handing out the cash. It's a question of different tax designs forcing the job market to send the money elsewhere. And the more tax brackets you have, the more precisely you can redirect that flow.
Other policies helped with this, too: Union membership was near its apex in 1960, which meant workers had more bargaining power. Fiscal and monetary policy combined to give us full employment on a regular basis, which also raised bargaining power. And the real value of the minimum wage was considerably higher. So taxes lowered the ceiling, the minimum wage and worker bargaining power raised the floor, and between the two we drove a sizeable majority of the wealth generated by the American economy into the pockets of everyday workers.
Then we allowed unions to collapse, we stopped bothering to ensure full employment, we let the minimum wage decay, and we dismantled the tax regime. Not surprisingly, the income going into the pockets of the elite shot up. Look at that first graph again. The one percent's share of all income generated by the economy went from 10 percent in the late 1970s to 20 percent today. That's a whole extra 10 percent of national income — $1.5 trillion in 2014. That's an extra $4,762 for every man, woman, and child in the bottom 99 percent, annually.
It's not going to them now because we, as a society, chose to send it elsewhere.

-
 Ex-South Korean leader gets life sentence for insurrection
Speed Read South Korean President Yoon Suk Yeol was sentenced to life in prison over his declaration of martial law in 2024
-
 At least 8 dead in California’s deadliest avalanche
Speed Read The avalanche near Lake Tahoe was the deadliest in modern California history and the worst in the US since 1981
-
 Political cartoons for February 19
Cartoons Thursday’s political cartoons include a suspicious package, a piece of the cake, and more


-
 The billionaires’ wealth tax: a catastrophe for California?
Talking Point Peter Thiel and Larry Page preparing to change state residency
-
 Bari Weiss’ ‘60 Minutes’ scandal is about more than one report
IN THE SPOTLIGHT By blocking an approved segment on a controversial prison holding US deportees in El Salvador, the editor-in-chief of CBS News has become the main story
-
 Has Zohran Mamdani shown the Democrats how to win again?
Today’s Big Question New York City mayoral election touted as victory for left-wing populists but moderate centrist wins elsewhere present more complex path for Democratic Party
-
 Millions turn out for anti-Trump ‘No Kings’ rallies
Speed Read An estimated 7 million people participated, 2 million more than at the first ‘No Kings’ protest in June
-
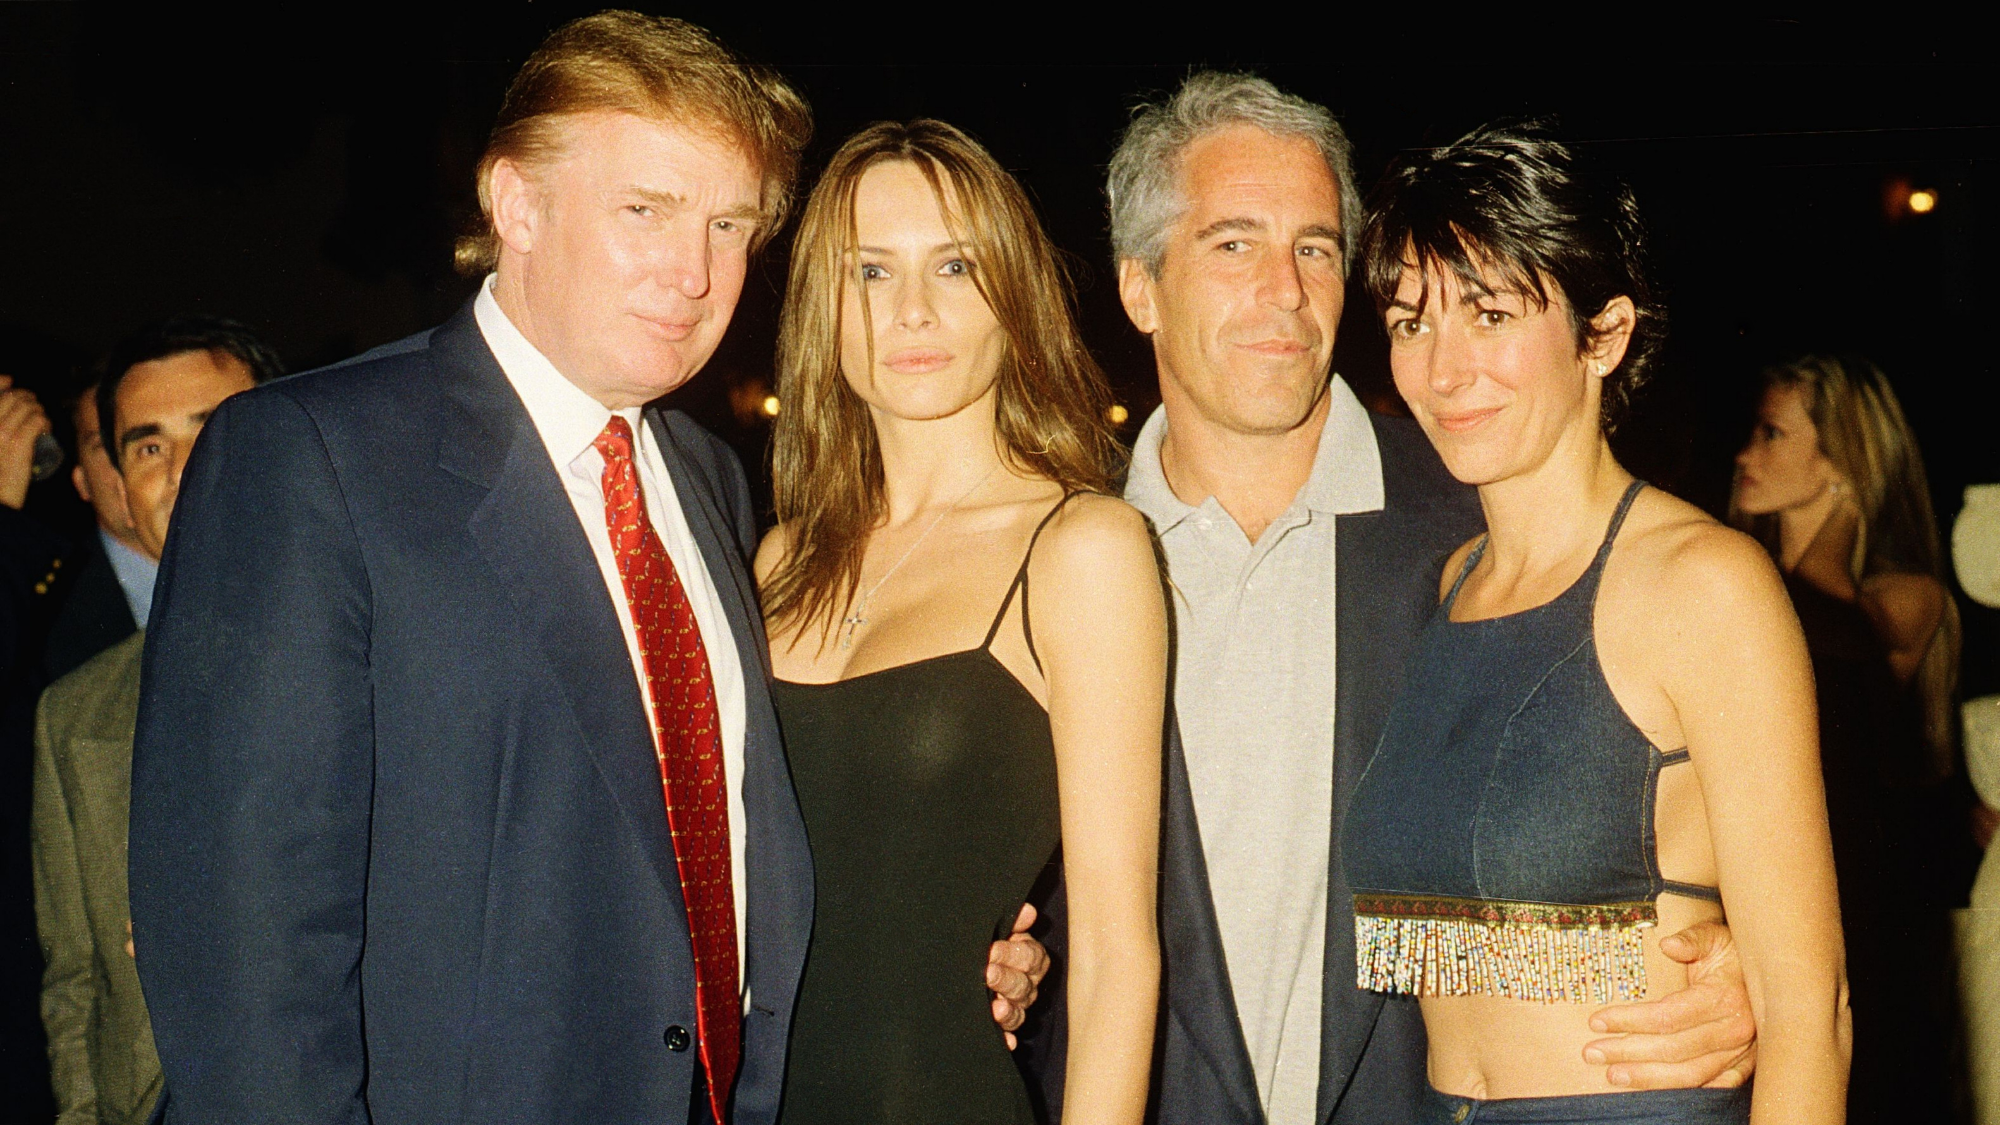 Ghislaine Maxwell: angling for a Trump pardon
Talking Point Convicted sex trafficker's testimony could shed new light on president's links to Jeffrey Epstein
-
 The last words and final moments of 40 presidents
The Explainer Some are eloquent quotes worthy of the holders of the highest office in the nation, and others... aren't
-
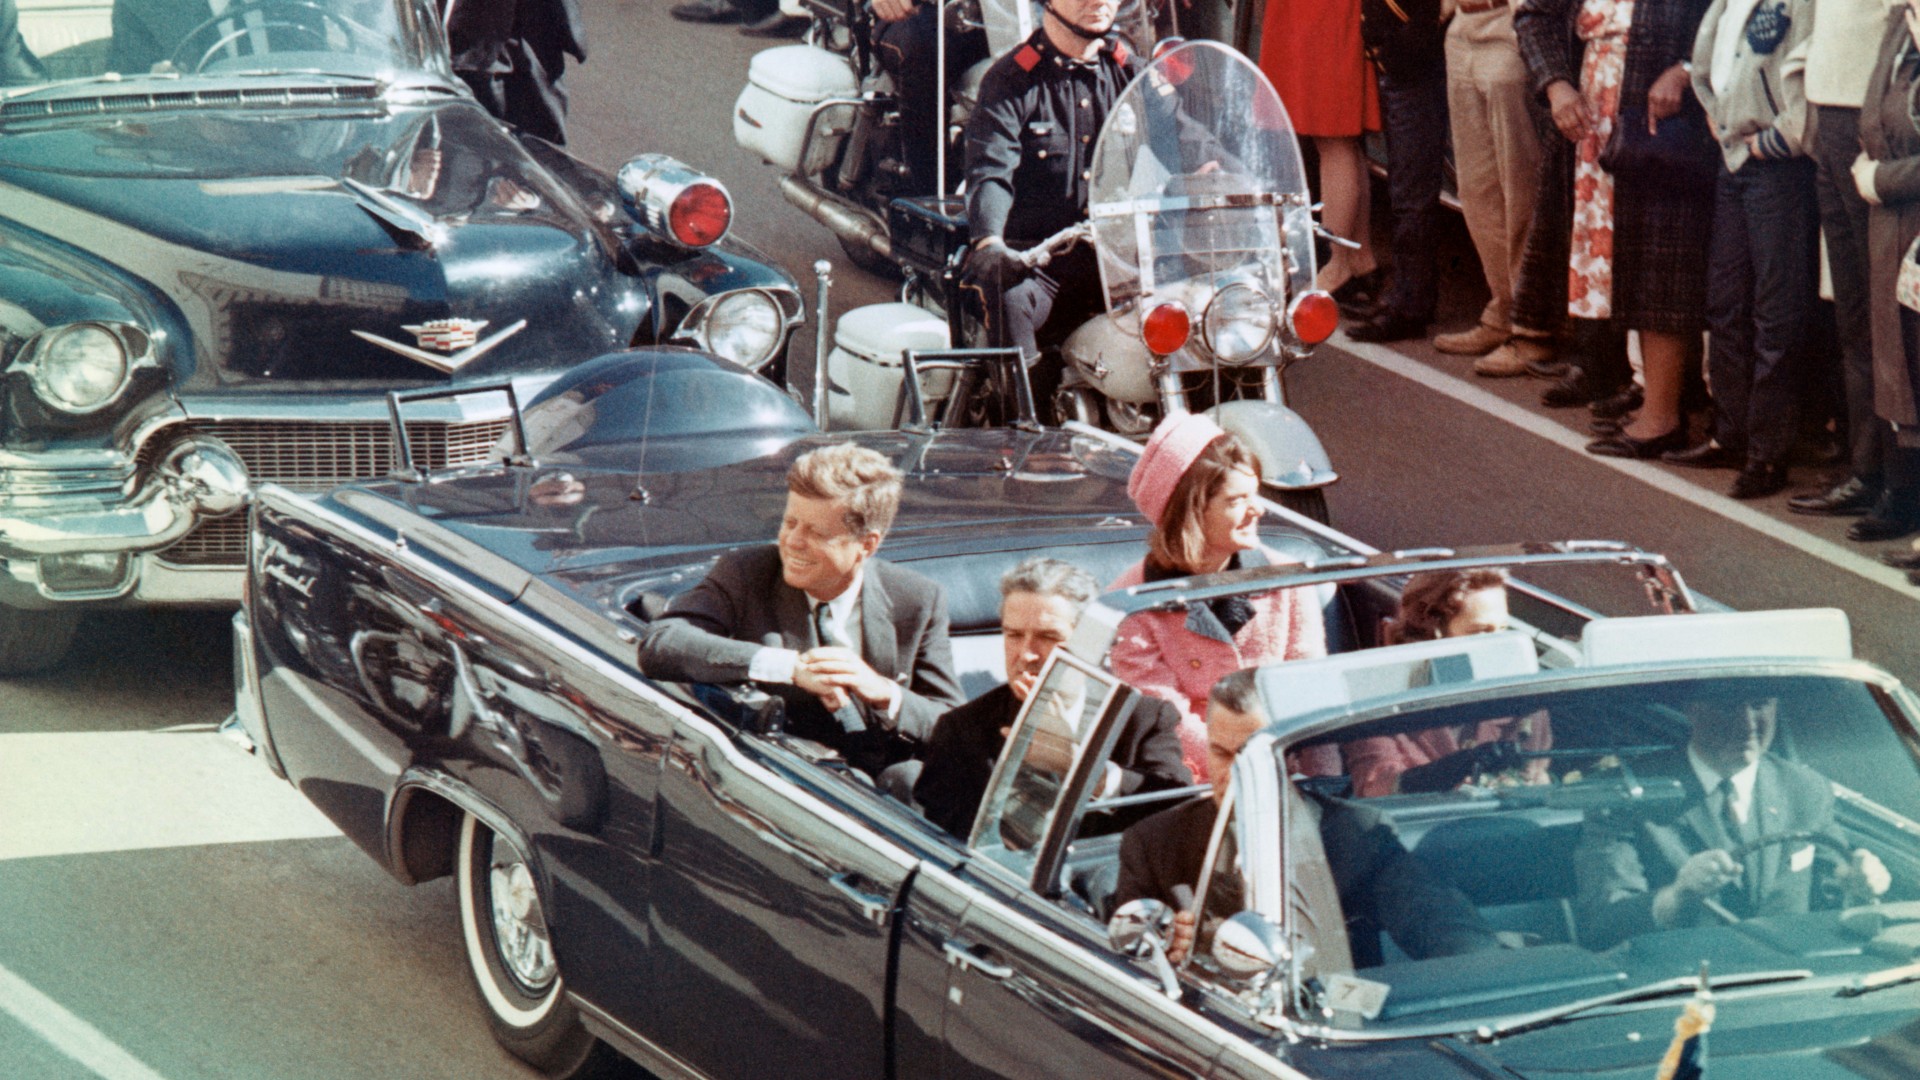 The JFK files: the truth at last?
In The Spotlight More than 64,000 previously classified documents relating the 1963 assassination of John F. Kennedy have been released by the Trump administration
-
 'Seriously, not literally': how should the world take Donald Trump?
Today's big question White House rhetoric and reality look likely to become increasingly blurred


