London house prices explained in five charts
The value of homes in the capital is falling after years of annual growth
A free daily email with the biggest news stories of the day – and the best features from TheWeek.com
You are now subscribed
Your newsletter sign-up was successful
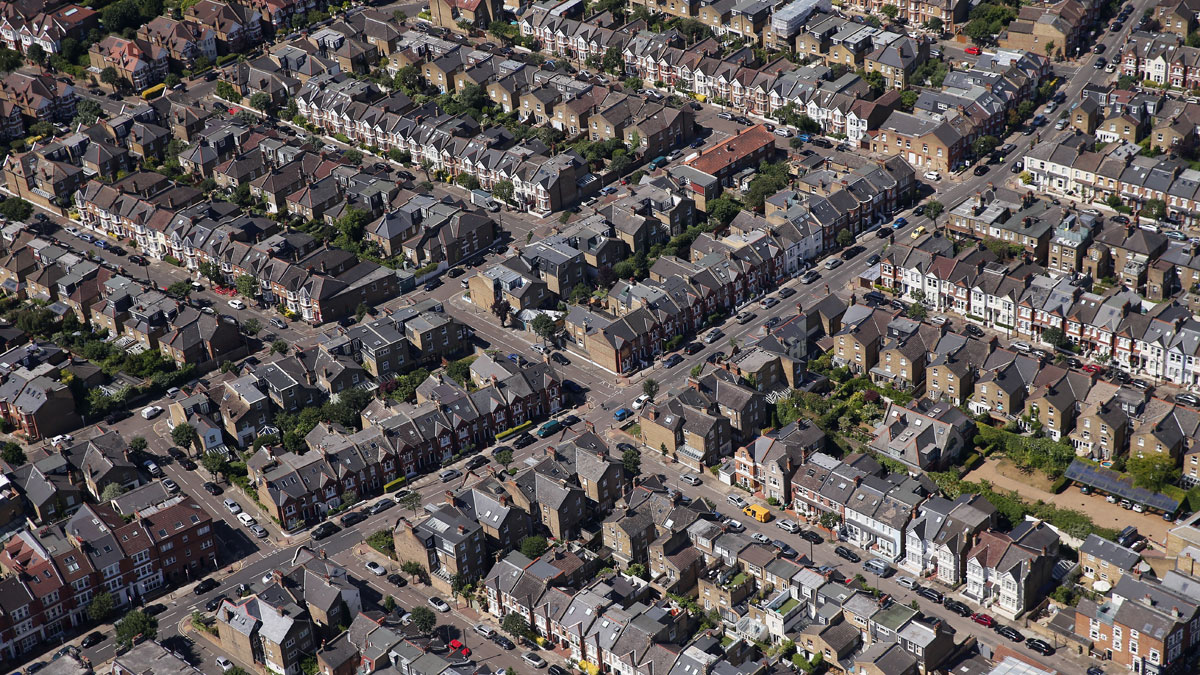
House prices in London fell by 0.6% in June, according to the UK’s official statistics body, the ONS. It might not sound like much but follows years in which prices grew by an annual average 7.5% between the end of 2009 and the end of 2017.
Prices have been broadly unchanged since the end of 2017, following years in which London has been the mainstay of the UK’s housing market. There has been a lot of speculation over the effect of Brexit on the London property market, but there is little data yet to back this up. There have been a number of factors at work that we can see, which have led to the weakening of prices, however, some of which are national in character – notably low real earnings growth – and some more local, including additional internal migration flows away from London.
In addition, since London prices have increased relative to the rest of the south-east, we might have expected the London market to have eased rather earlier. If so, recent changes could simply be an unwinding of the overvaluation of recent years. It is important to remember that London prices remain very high with an average price of £475,000.
The Week
Escape your echo chamber. Get the facts behind the news, plus analysis from multiple perspectives.

Sign up for The Week's Free Newsletters
From our morning news briefing to a weekly Good News Newsletter, get the best of The Week delivered directly to your inbox.
From our morning news briefing to a weekly Good News Newsletter, get the best of The Week delivered directly to your inbox.
Below are five charts that explain what is going on.
1. The ripple effect
Over successive cycles since the early 1970s, the UK has seen a phenomenon known as the ripple effect. In economic booms, house prices have tended to rise first in London and the south-east and then gradually, over time, the other regions have caught up. London has always stayed out in front, but the percentage difference typically has not become bigger.
As the graph above shows, prices in London, on average, have been about double those in the north (represented here by Yorkshire and Humberside, which is used as a comparison because the regional boundaries have not changed over time). The exception to the relative changes is the period since the mid-1990s, where historical positions have yet to be restored.
A free daily email with the biggest news stories of the day – and the best features from TheWeek.com
2. Income growth
Changes in regional prices are strongly influenced by national factors, including the low levels of interest rates and the growth in real incomes. We know that real incomes have a strong effect on house prices. As a rule of thumb a 1% increase in real incomes leads to a 2% increase in real house prices, because households can afford to pay more. And so, typically over the cycle, house prices exhibit more volatility than incomes.
It is particularly noticeable that the Office for Budget Responsibility (OBR), the UK’s independent fiscal watchdog, has scaled down its national house price forecasts, recognising that weaker productivity is leading to lower real income growth. For example, in March 2016, the OBR expected nominal house prices to rise by 4.7% in 2019; by March 2018, this had been revised downwards to 2.7%.
3. Supply, demand and regional patterns
Poor income growth explains why London is operating in a weaker national housing environment, but it does not explain the regional price pattern. Higher demand in London, supply shortages and internal migration patterns also play a role.
For this, it helps to look more closely at the south-east – so inner London relative to outer London and relative to the south-east as a whole. The key feature is that we are now looking at areas that are not physically very distant from each other and we know that most moves take place over very short distances – according to the 2014-15 English Housing Survey, 74% of movers, where the household head was under the age of 55, relocated by under ten miles and 24% moved under one mile.
London has long had more people leaving the city than entering it. While it attracts the young, London loses the slightly older age groups. This loss was declining sharply until 2009, but then accelerated again, particularly in 2016 and 2017 to exceed 100,000 people.
This pattern is broadly consistent with the observed path of house prices. Since a high proportion of people leaving London go elsewhere in the south-east, we expect to see a fall in the ratio of house prices in London relative to the south-east in the last two years and this appears to have been the case.
4. Property types consistent
The relative prices for different types of property (detached houses, semis, terraced houses and flats) have gone up and down in a similar manner, although there are, of course, absolute differences in the prices. Just as households can move between locations, they can substitute between property types which leads to similar price movements.
Therefore the next chart concentrates on the differences between the prices of terraced properties in inner and outer London. They indicate there have been recent relative price falls in inner London, which is again consistent with households moving out from the more expensive inner areas.
5. Investment properties
Nevertheless, migration flows are not the whole story. Nor are the relative prices likely to be explained in terms of supply shortages – the south-east also suffers from shortages. But a further explanation lies in terms of the monetary environment and notably low levels of interest rates.
Housing in London is heavily influenced by its role as an investment as much as a consumption good. The investment motives for buying housing are also important in other areas but, arguably, London has special characteristics, and prices in London are more responsive to changes in interest rates than elsewhere. The possibility exists, therefore, that as interest rates gradually rise in the economy, London will be more strongly affected than other regions, beginning to restore some of the historical patterns seen in the first graph.
Yet, for all the talk of falling house prices, we should bear in mind that the average price of even a flat in London is still well over £400,000. By comparison the average price of a flat in the south-east is closer to £200,000 – and even this is beyond the resources of most potential first-time buyers without significant additional support. So the price falls we are seeing are unlikely to have any significant benefits for first-time buyers. At least on the scale that has taken place so far, the fall simply implies modest capital losses for existing owners.By Geoff Meen, Professor of Applied Economics at the University of Reading
This article is republished from The Conversation under a Creative Commons license. Read the original article.
-
 Political cartoons for February 15
Cartoons Sunday's political cartoons include political ventriloquism, Europe in the middle, and more
-
 The broken water companies failing England and Wales
Explainer With rising bills, deteriorating river health and a lack of investment, regulators face an uphill battle to stabilise the industry
-
 A thrilling foodie city in northern Japan
The Week Recommends The food scene here is ‘unspoilt’ and ‘fun’
-
 The impact of Russia sanctions on London house prices
In Depth Oligarchs tipped to ‘flee’ the market amid plans to seize properties owned by Russians with Kremlin links
-
 UK house prices in 2022: what the experts think
feature Sellers’ market, what next and mortgage matters
-
 Britain’s most expensive streets
The Week Recommends New names sneak into list of priciest roads
-
 House price predictions: best time to buy or sell in 2020
In Depth Brexit still creating uncertainty but prices set for a Boris-induced spring boost
-
 London house prices: new pollution hotspot website threatens to push down values
Speed Read Buyers encouraged to ask for major discounts in areas with dirtiest air
-
 London landlords are paid £14m to house homeless people
Speed Read Nearly 6,000 payments were made last year amid cuts to social housing
-
 London house prices: the boroughs rising and falling
Speed Read Largest annual increases are in Croydon, while Westminster suffers ‘thumping’ drop
-
 Is post-Brexit bounce here to stay?
In Depth