Last Friday's jobs report was a mixed bag. On the one hand, we had mediocre job gains of 151,000. On the other hand, the unemployment rate finally broke through the 5 percent floor and fell to 4.9 percent. It hasn't done that since February 2008.
Even better, that unemployment rate is pretty much where mainstream economists think full employment resides. That's when the matchup between the number of people looking for work and the number of jobs available is so tight that workers can begin bargaining up wages, because employers fear losing them to competitors.
So break out the champagne, right?
Subscribe to The Week
Escape your echo chamber. Get the facts behind the news, plus analysis from multiple perspectives.
No so fast. Another metric, namely the Federal Reserve's preferred measure of inflation, was only at 1.4 percent in December. The Fed's target is 2 percent, which it's largely failed to hit since the Great Recession.
This suggests full employment is still a ways off. When workers can bargain up their wages, that extra money comes out of businesses' overall revenue. That squeezes profits, and eventually the wage hikes translate into price hikes for businesses' goods and services. Spread those price hikes out across the entire economy, and you get inflation.
Now, if productivity grows at a reasonable clip, that means businesses are able to do more at less cost. So the wage increases can draw on that newly available money instead of driving up prices. When rising wages overtake the combined ability of profit margins and productivity increases to absorb them, that's generally when you can expect rising inflation rates.
So the real signs of bottom-up pressure on the economy are rising rates of wage growth and rising rates of inflation. The best sign of all is probably the rate of nominal wage growth — i.e. wages including inflation.
You could also look at real wage growth, which is wages with inflation factored out. This is tempting, since real wage growth is what captures real increases in living standards. But workers and employers always bargain with the knowledge of inflation in the back of their heads. So if you want to measure how much power workers wield in the economy, nominal wage growth is the way to go.
The good news is that nominal wage growth was on an upward trend in 2015. The bad news is that if we zoom out to a bigger historical look, nominal wage growth is still super low.
Now, at the risk of throwing more charts at you, here's a historical picture of when we think we've been at full employment.
(Graph courtesy of Wall Street Journal economics correspondent Josh Zumbrum.)
Now, like I said, the way mainstream economists use the unemployment rate to measure full employment has always been kind of sketchy. The blue line above is what's called the NAIRU, which is where models generally estimate full employment is at. And that line is probablytoo high.
But we were definitely at full employment in the late 1960s and early 1970s. Since then we've maybe briefly touched it a few times, with the exception of one noticeable burst in the late 1990s. This is part of the argument that since the late 1970s or early 1980s, the economy has been fundamentally different, and sicker, than it used to be.
Now let's look at that historical wage growth chart again, with inflation (in red) layered on top.
In the late 1960s and early 1970s, inflation got up to 4 or 5 percent, while the rate of nominal wage growth climbed to 6 percent or higher. Then we got stagflation, and finally the Federal Reserve's decision to massively hike interest rates to kill inflation. That produced the deep recession of the early 1980s, and things have never been quite the same since: Inflation has steadily declined, and the highest nominal wage growth has gotten is 4 percent.
Now we can compare our current situation to previous bursts of full employment. Today, inflation is 1.4 percent and wage growth is 2.5 percent. That's way lower on both counts than what we had in the late 1960s. Meanwhile, the unemployment rate is 4.9 percent, compared to a remarkably low 3.4 percent back then.
Of course, you could argue that this period was followed by completely out of control inflation, so maybe the pendulum swung too far in the direction of full employment for too long.
Is the late 1990s a better model? Wage growth was higher then, at 4 percent. The unemployment rate was lower, at 4 percent, but not much lower than today. And at 2 percent, inflation wasn't much higher than it is now either — if nothing else, real wage growth was great then! But low inflation might be a bad sign, since what fueled the late '90s boom wasn't so much the bottom-up pressure of worker power as it was the stock bubble, which promptly popped in 2001. Then the next round of growth in the late 2000s was driven by the housing bubble, and we all know how that ended.
So there's probably a sweet spot we haven't hit yet. But one thing's for sure: We live in strange times, and not in a good way.
And the trend lines say they aren't going to end anytime soon.
Sign up for Today's Best Articles in your inbox
A free daily email with the biggest news stories of the day – and the best features from TheWeek.com


 The pros and cons of noncompete agreements
 What experts are saying about the economy's surprise contraction
 The death of cities was greatly exaggerated
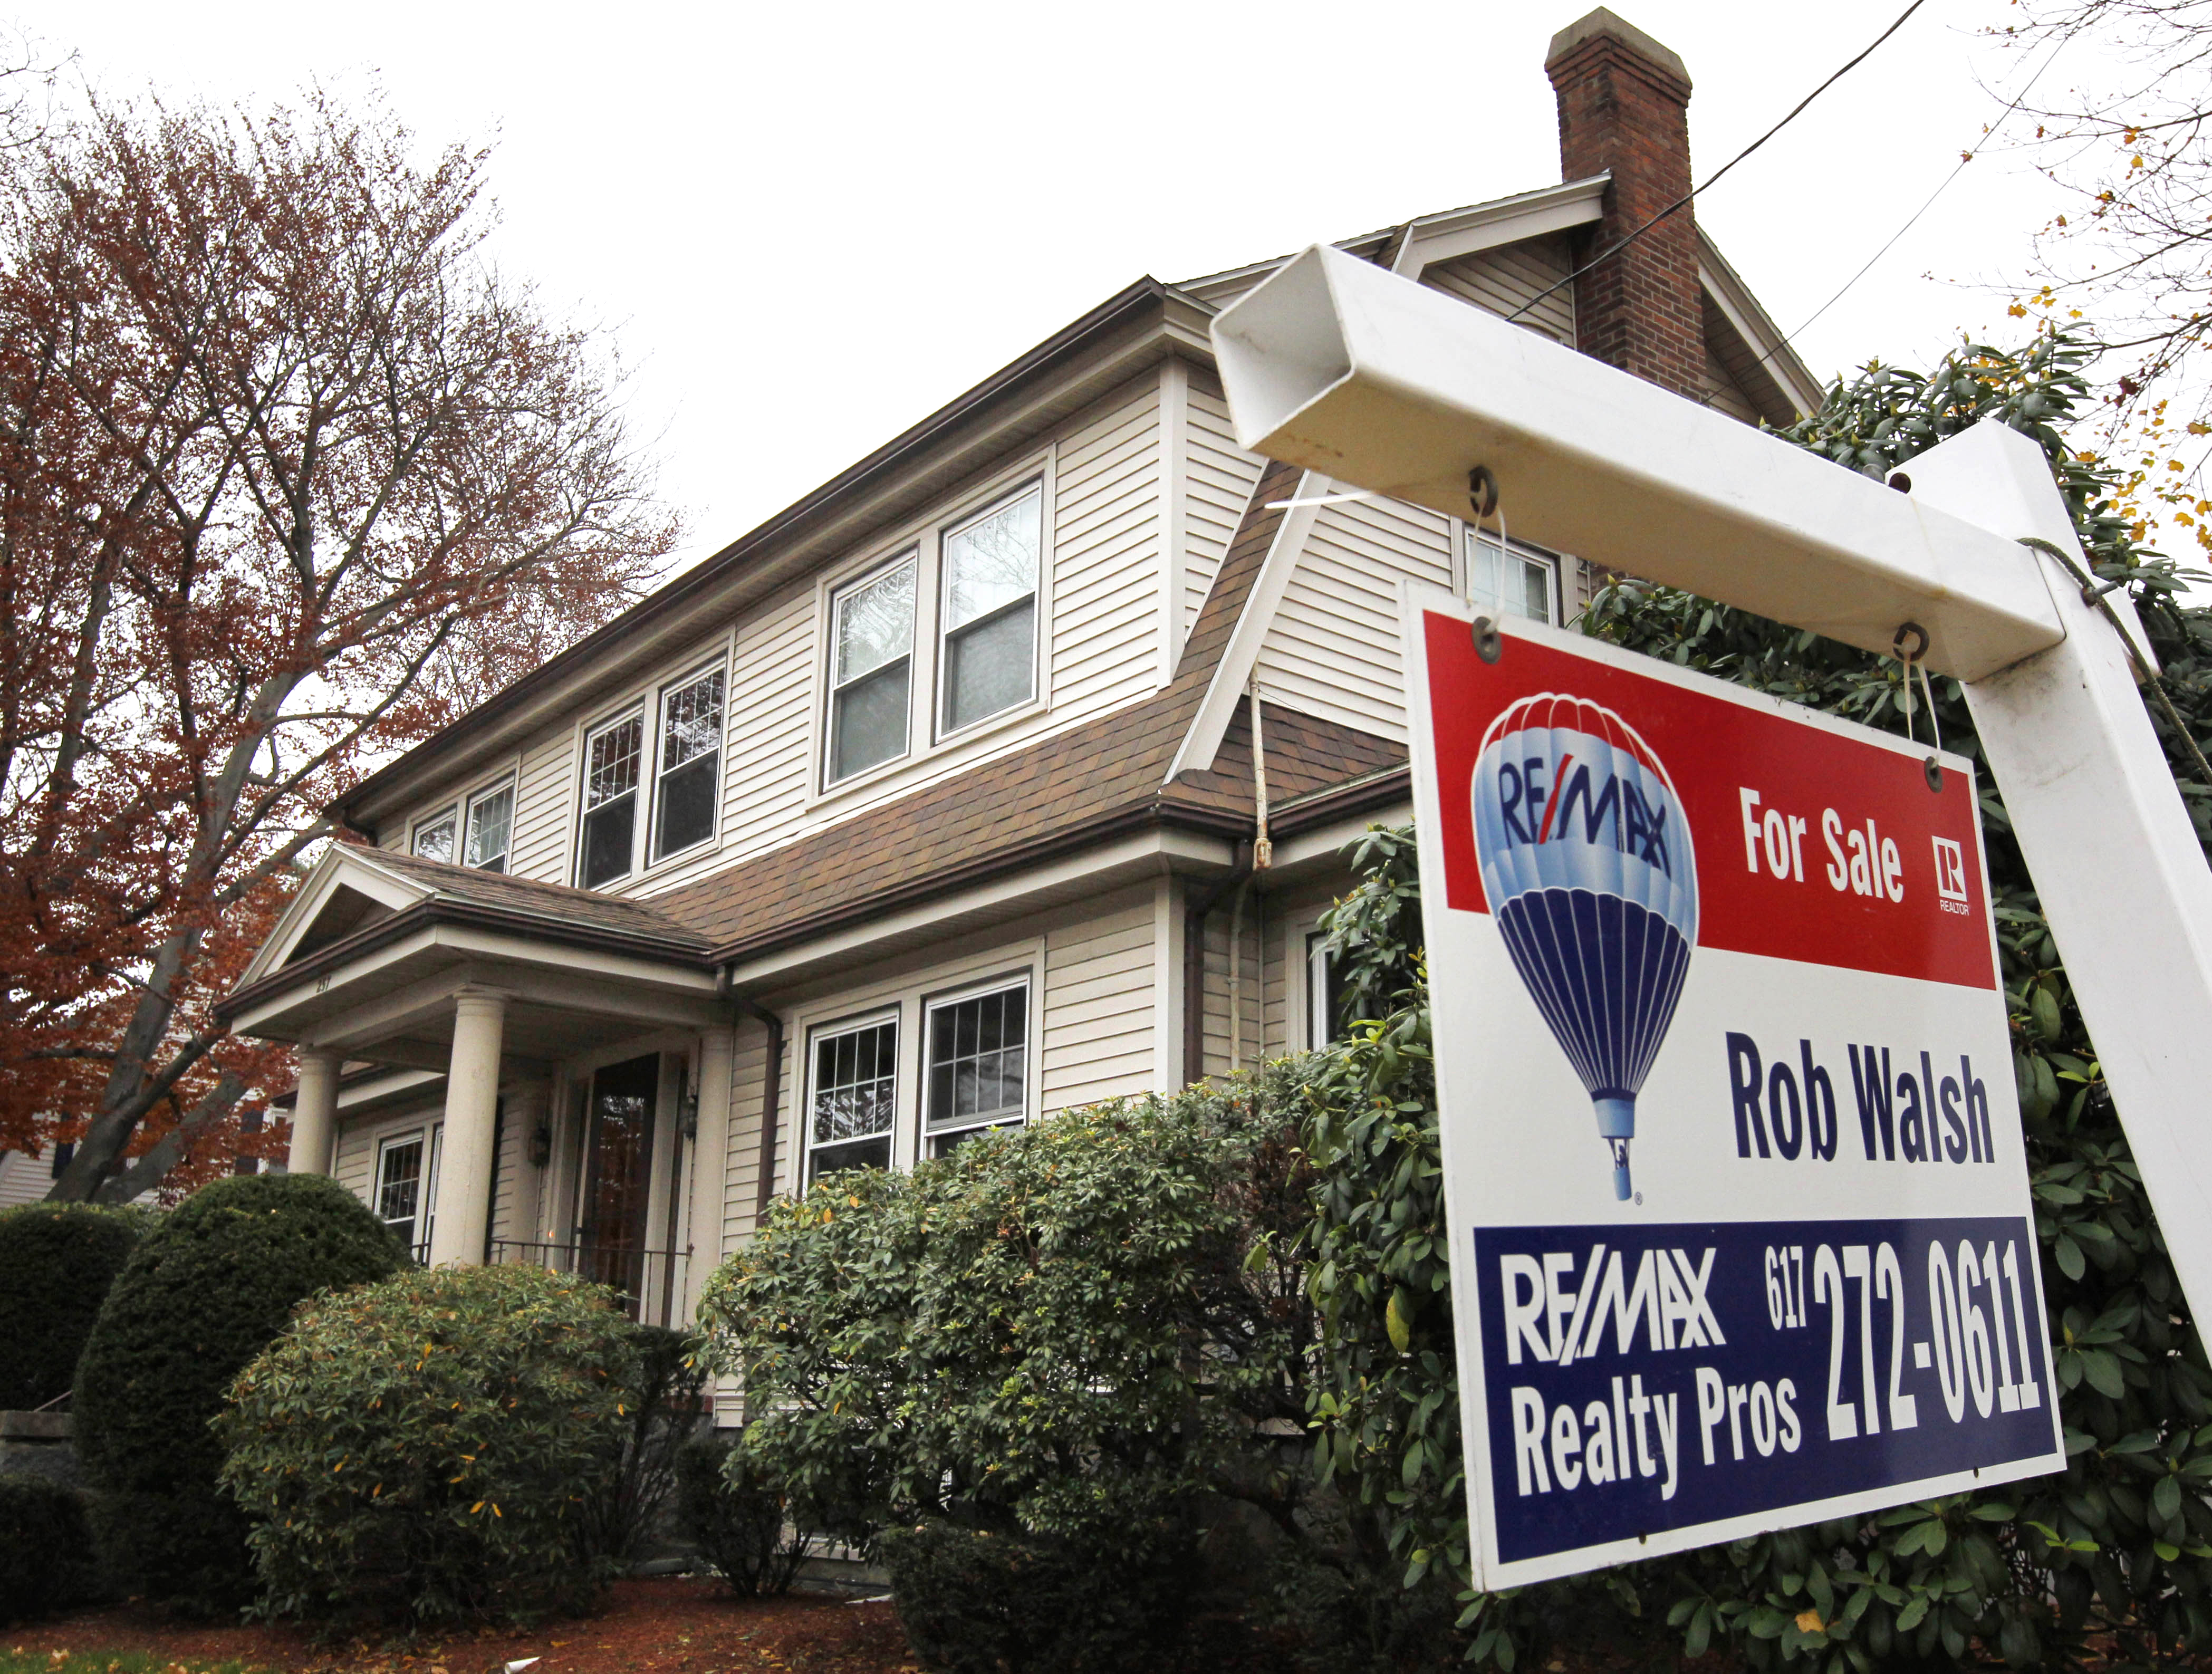 The housing crisis is here
 How to be an ally to marginalized coworkers
 What the stock market knows
 Can the government save small businesses?
 How the oil crash could turn into a much bigger economic shock


