How World War II reveals the actual limits of deficit spending
Just how much money can we put on America's credit card? This much.

A free daily email with the biggest news stories of the day – and the best features from TheWeek.com
You are now subscribed
Your newsletter sign-up was successful
Just how much money can we put on America's credit card?
This has been a point of contention between the left and the right for years. No sensible person argues the sky's the limit on America's capacity to borrow. Pile on enough debt fast enough, and you will do serious damage to the economy. But are we close to that tipping point, as conservatives and the GOP argue? Or are we very far away from it, as progressives (like me) insist?
To definitively answer this question, we need data. Specifically, we need a real-world example of America pushing its borrowing capacity to the max. As it turns out, we've got one: World War II.
The Week
Escape your echo chamber. Get the facts behind the news, plus analysis from multiple perspectives.
Sign up for The Week's Free Newsletters
From our morning news briefing to a weekly Good News Newsletter, get the best of The Week delivered directly to your inbox.
From our morning news briefing to a weekly Good News Newsletter, get the best of The Week delivered directly to your inbox.
To the graphs!
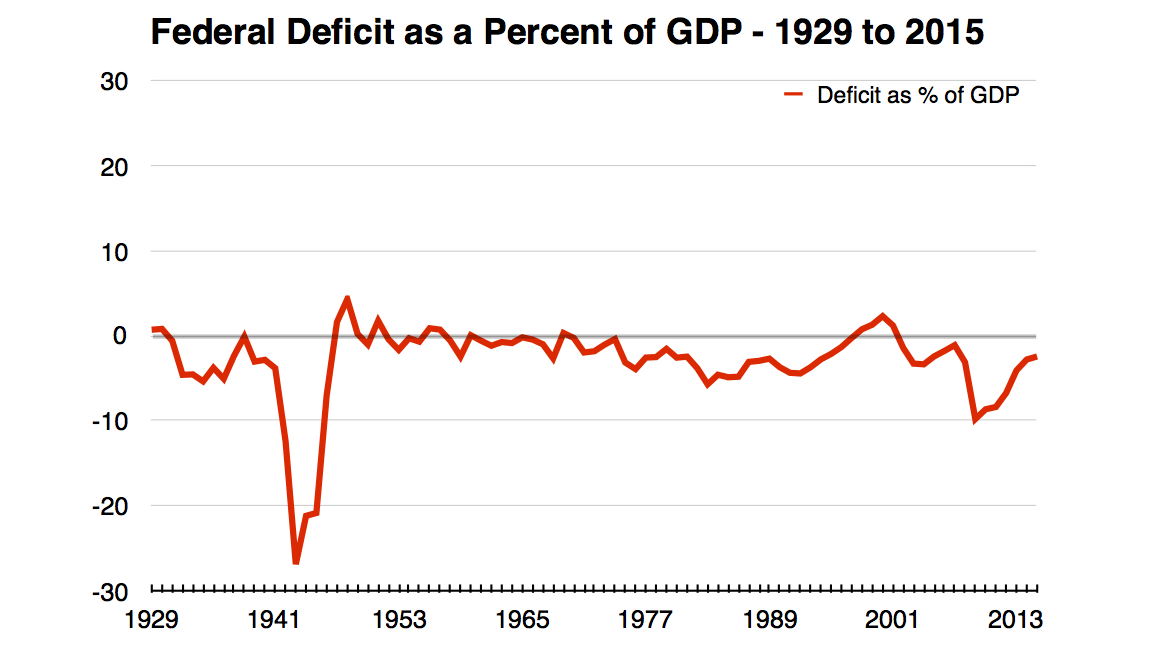
Above is the federal government's annual deficit as a share of gross domestic product (GDP), from 1929 to 2015— basically, the rate at which the U.S. borrowed.
You can see that deficit spending was huge during WWII. It peaked at over 26 percent of GDP in 1943. By comparison, the highest the deficit got in the aftermath of the Great Recession was 9.8 percent.
Now, an important caveat: As a consumer, you worry about putting money on your credit card because you're cash-constrained. To have money to pay off your debt, you have to earn it. This is not true of the federal government. It has the power to print all the money it wants. It has siloed off that power with the Federal Reserve, so when Congress sets taxing and spending policy, it acts like it's cash-constrained even though it's technically not.
A free daily email with the biggest news stories of the day – and the best features from TheWeek.com
Most of the time Congress and the Fed are supposed to decide their own policy agendas separately — Congress controlling fiscal policy and the Fed setting interest rates. But occasionally they'll work together: During the crisis of WWII, the Fed agreed to print as much money as needed to buy up enough U.S. debt and keep interest rates low. So despite that enormous bout of deficit spending, interest rates stayed at rock-bottom until the end of the 1950s.
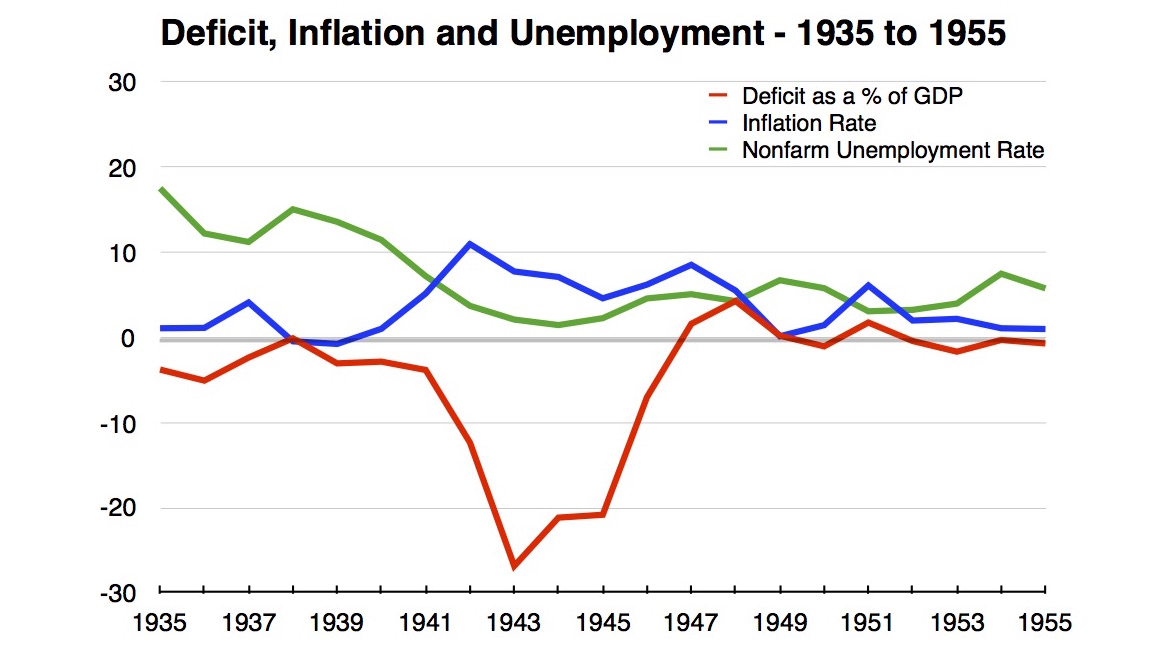
This also clarifies just how government borrowing can destroy the economy. Not through default, since it can always print money to pay its debts, but by driving inflation through the roof. And indeed, if we zoom in on the 1935-to-1955 period, the Fed's preferred measure of inflation hit 11 percent in 1942.
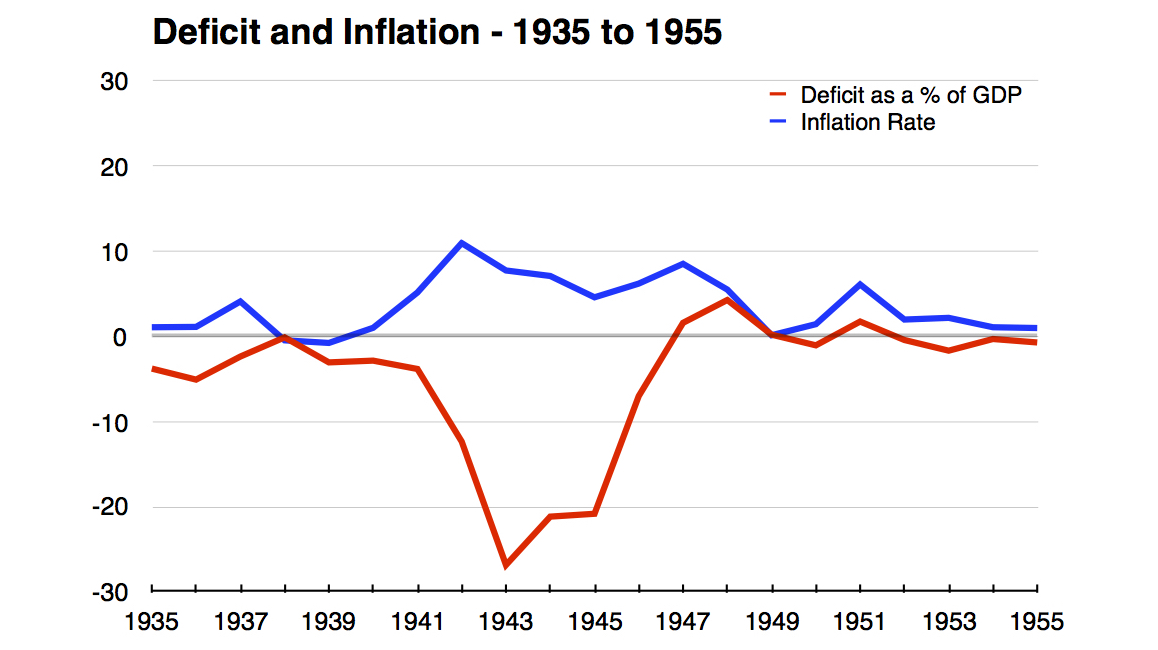
Then it fell back to earth. Why? The government issued lots of price controls and regulations to contain inflation during the war. But it also hiked taxes, and it loaded most of its hikes on the wealthy. Everyone saw their top marginal income tax rate rise at least 10 percentage points. But in 1941, the top tax bracket began at $78 million in 2013 dollars and was taxed at a rate of 81 percent. In 1942, it was $2.8 million, and taxed at 88 percent. Far from slowing down the economy, these hikes balanced the deficit, cooled off inflation, and were followed by a remarkable two decades of broadly shared growth and prosperity. (Those tax rates stayed in effect until the 1970s.)
If we zoom back out to the 1929-to-2015 range, we can contrast WWII with another bout of high inflation we had in the late 1970s:
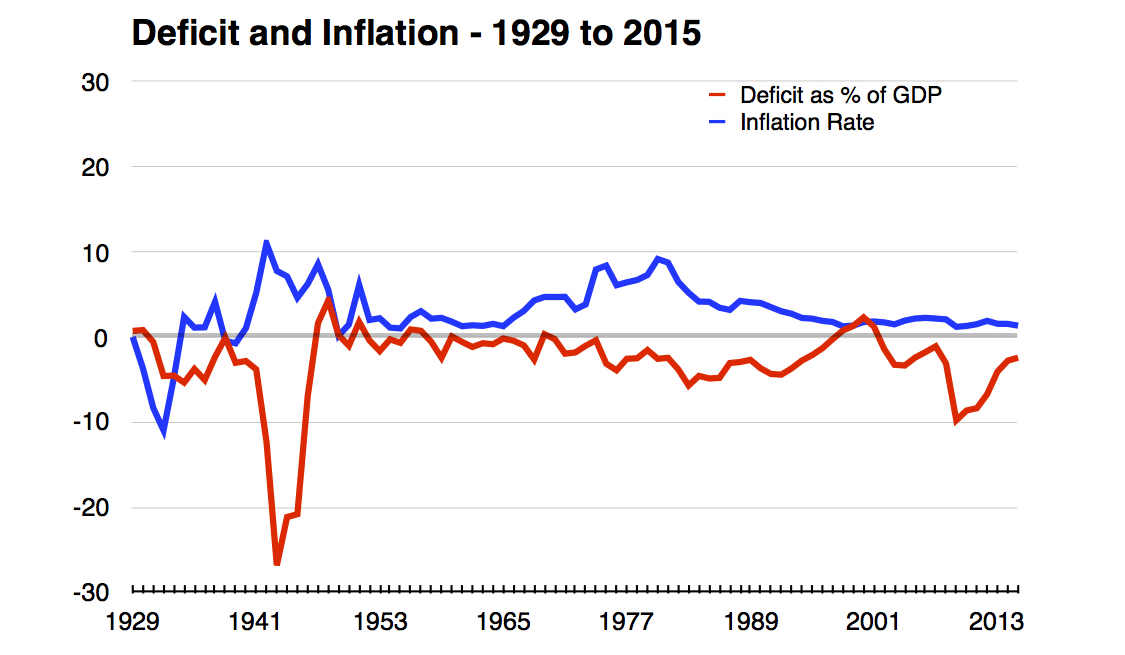
As you can see, this time inflation occurred with deficits that maxed out at only 6 percent.
The difference is the state of the economy. When joblessness is high and wage growth is sluggish, the economy can absorb lots of deficit spending before inflation picks up. When joblessness is low and wage growth is high, it can absorb a lot less.
When WWII started, we were just coming off the Great Depression. Unemployment was over 17 percent in 1935, and still over 7 percent in 1941 when deficit spending really took off. Here's the 1935-to-1955 graph with unemployment added in:
When inflation hit in the 1970s, by contrast, we were coming off the prosperity of the 1950s and 1960s when unemployment regularly dipped below 4 percent. Here's 1929-to-2015 with unemployment:
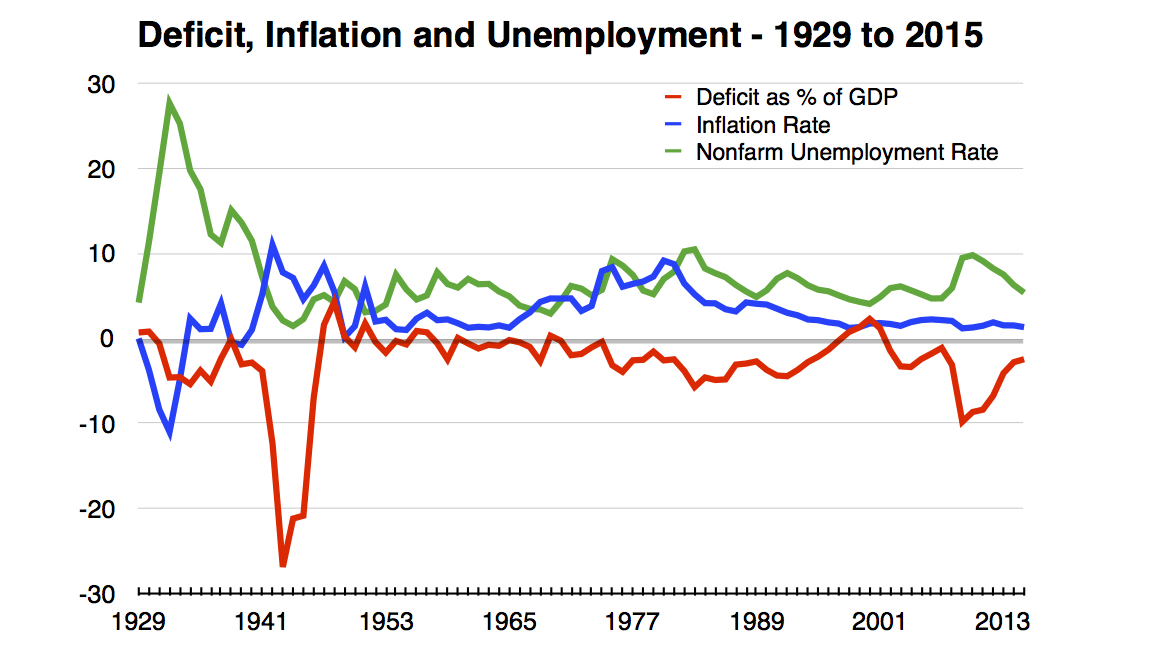
And while we don't have nominal wage growth data going all the way back to WWII, it was absolutely spectacular from 1970 to 1980 — bouncing around between 6 and 9 percent.
The other big difference between the WWII-era and the 1970s is how inflation was killed. In the '70s, the U.S. government didn't raise taxes, it cut them. And then the Fed massively hiked interest rates, causing a devastating recession that has scarred the American economy ever since.
What we have here are two stories of stimulating the economy through deficit spending, and two ways we went about controlling the resulting inflation. The '70s way of interest rate hikes destroyed the economy and much of the working class. The '40s way of tax hikes on the wealthy was followed by the economic golden age of the 20th century.
So what's the lesson for today?
We clearly don't have as much room to deficit spend as we did going into WWII. Unemployment hit 10 percent in the Great Recession and is now at 5 percent — far from the peaks of the Great Depression. On the other hand, we probably have a good deal more room to spend than in the '70s. The unemployment rate today is not as good a measure of slack in the economy as it was going into the '70s, because of the fall off in labor force participation. This is especially evident in our wage growth. As you can see above, it stands at a measly 2.5 percent — and that's a high for the post-2008 era.
The federal deficit was about 2.5 percent of GDP in 2015, and I think it could get as high as 7.5 or 8 percent. That would be an extra $900 billion a year of spending, and there's plenty of useful stuff we could do with that money. And if inflation (finally) starts to rise, Lord knows we've got room to hike income taxes on the wealthy.
America, it's time to treat yourself.
Jeff Spross was the economics and business correspondent at TheWeek.com. He was previously a reporter at ThinkProgress.
-
 How the FCC’s ‘equal time’ rule works
In the Spotlight The law is at the heart of the Colbert-CBS conflict
-
 What is the endgame in the DHS shutdown?
Today’s Big Question Democrats want to rein in ICE’s immigration crackdown
-
 ‘Poor time management isn’t just an inconvenience’
Instant Opinion Opinion, comment and editorials of the day
-
 The pros and cons of noncompete agreements
The Explainer The FTC wants to ban companies from binding their employees with noncompete agreements. Who would this benefit, and who would it hurt?
-
 What experts are saying about the economy's surprise contraction
The Explainer The sharpest opinions on the debate from around the web
-
 The death of cities was greatly exaggerated
The Explainer Why the pandemic predictions about urban flight were wrong
-
 The housing crisis is here
The Explainer As the pandemic takes its toll, renters face eviction even as buyers are bidding higher
-
 How to be an ally to marginalized coworkers
The Explainer Show up for your colleagues by showing that you see them and their struggles
-
 What the stock market knows
The Explainer Publicly traded companies are going to wallop small businesses
-
 Can the government save small businesses?
The Explainer Many are fighting for a fair share of the coronavirus rescue package
-
 How the oil crash could turn into a much bigger economic shock
The Explainer This could be a huge problem for the entire economy
