The rise of the filibuster, in one maddening chart
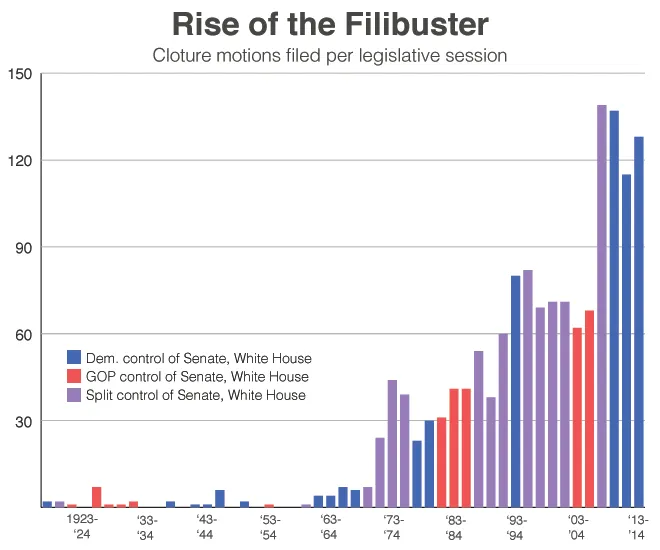
Senate Republicans on Wednesday blocked a vote on a bill that would raise the federal minimum wage from $7.25 to $10.10 per hour. Blame the filibuster, which has in the past four decades become an increasingly popular tool for the minority party to stonewall legislation that could otherwise pass the upper chamber with a simple majority.
The following chart shows the number of cloture motions in each session of Congress since 1917, using data from the Senate's website. Technically, the tallies don't represent true talking filibusters, but rather all instances where someone called for a procedural vote to end potentially endless debate and hold a pass/fail vote on legislation.

The Week
Escape your echo chamber. Get the facts behind the news, plus analysis from multiple perspectives.

Sign up for The Week's Free Newsletters
From our morning news briefing to a weekly Good News Newsletter, get the best of The Week delivered directly to your inbox.
From our morning news briefing to a weekly Good News Newsletter, get the best of The Week delivered directly to your inbox.

