

The College Board announced today that it would overhaul the SAT exam, citing numerous flaws in the test's design. And in particular, the company conceded that the standardized test put lower-income students at a huge disadvantage. How much of a disadvantage? The following chart shows average test scores for all test-takers, broken down by family income, in 2013:

Subscribe to The Week
Escape your echo chamber. Get the facts behind the news, plus analysis from multiple perspectives.

Sign up for The Week's Free Newsletters
From our morning news briefing to a weekly Good News Newsletter, get the best of The Week delivered directly to your inbox.
From our morning news briefing to a weekly Good News Newsletter, get the best of The Week delivered directly to your inbox.

-
 Can Texas redistricting save the US House for the GOP?
Today's Big Question Trump pushes a 'ruthless' new plan, but it could backfire
-
 'No one should be surprised by this cynical strategy'
Instant Opinion Opinion, comment and editorials of the day
-
 Intellectual property: AI gains at creators' expense
Feature Two federal judges ruled that it is fair use for AI firms to use copyrighted media to train bots


-
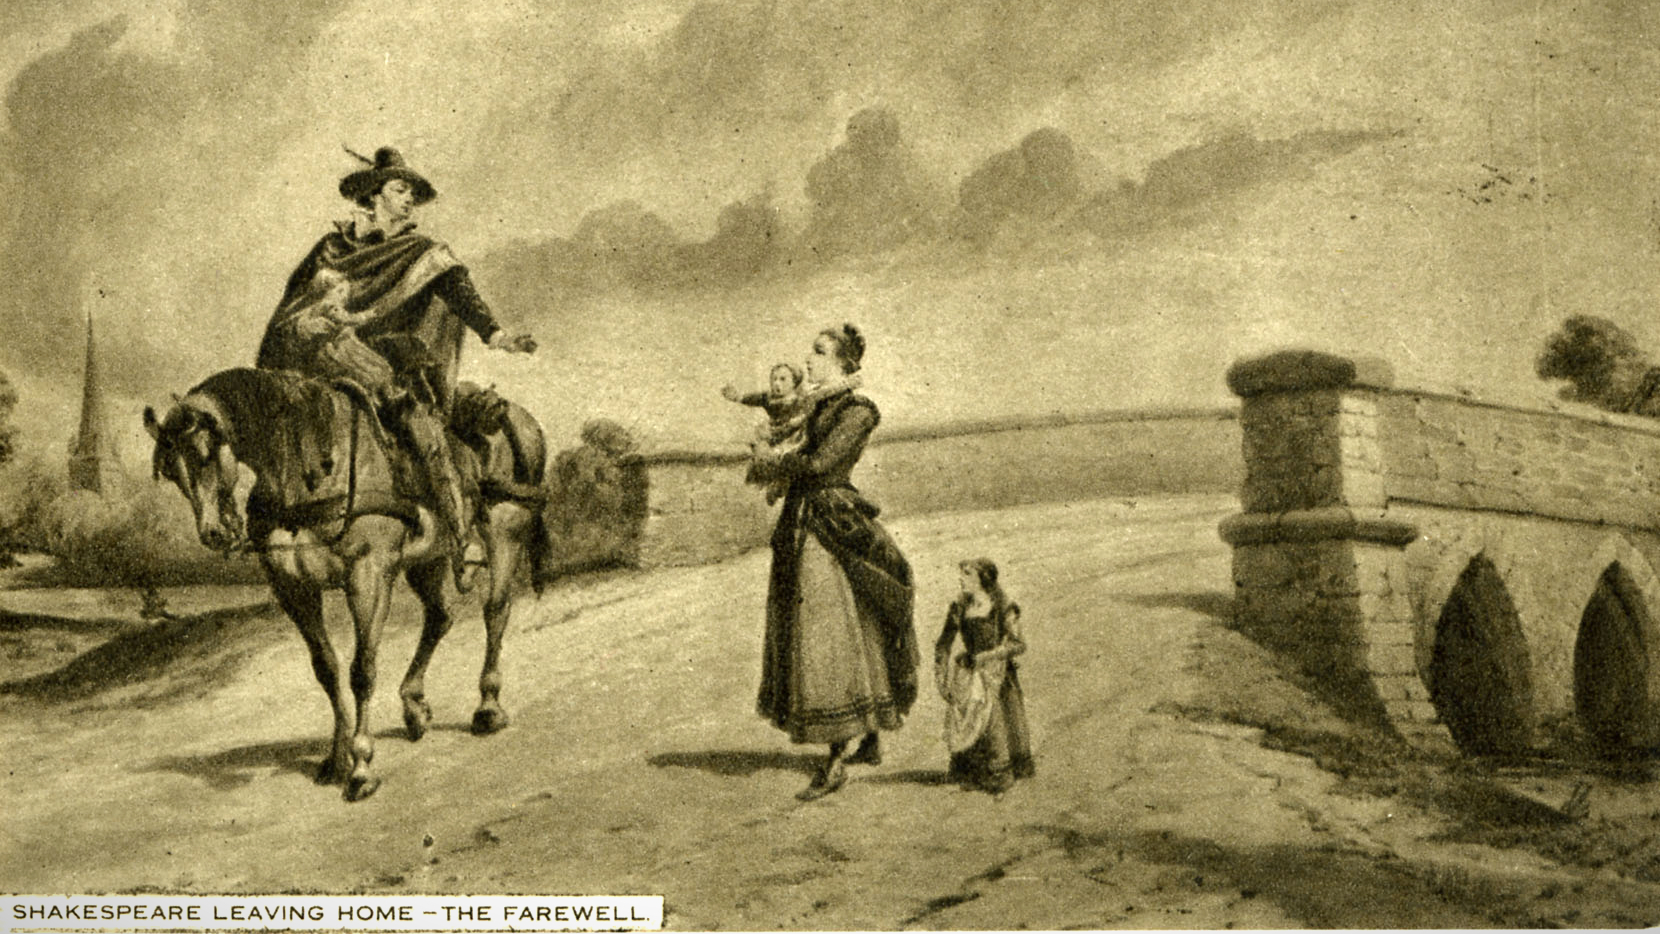 Shakespeare not an absent spouse, study proposes
speed read A letter fragment suggests that the Shakespeares lived together all along, says scholar Matthew Steggle
-
 New Mexico to investigate death of Gene Hackman, wife
speed read The Oscar-winning actor and his wife Betsy Arakawa were found dead in their home with no signs of foul play
-
 Giant schnauzer wins top prize at Westminster show
Speed Read Monty won best in show at the 149th Westminster Kennel Club dog show
-
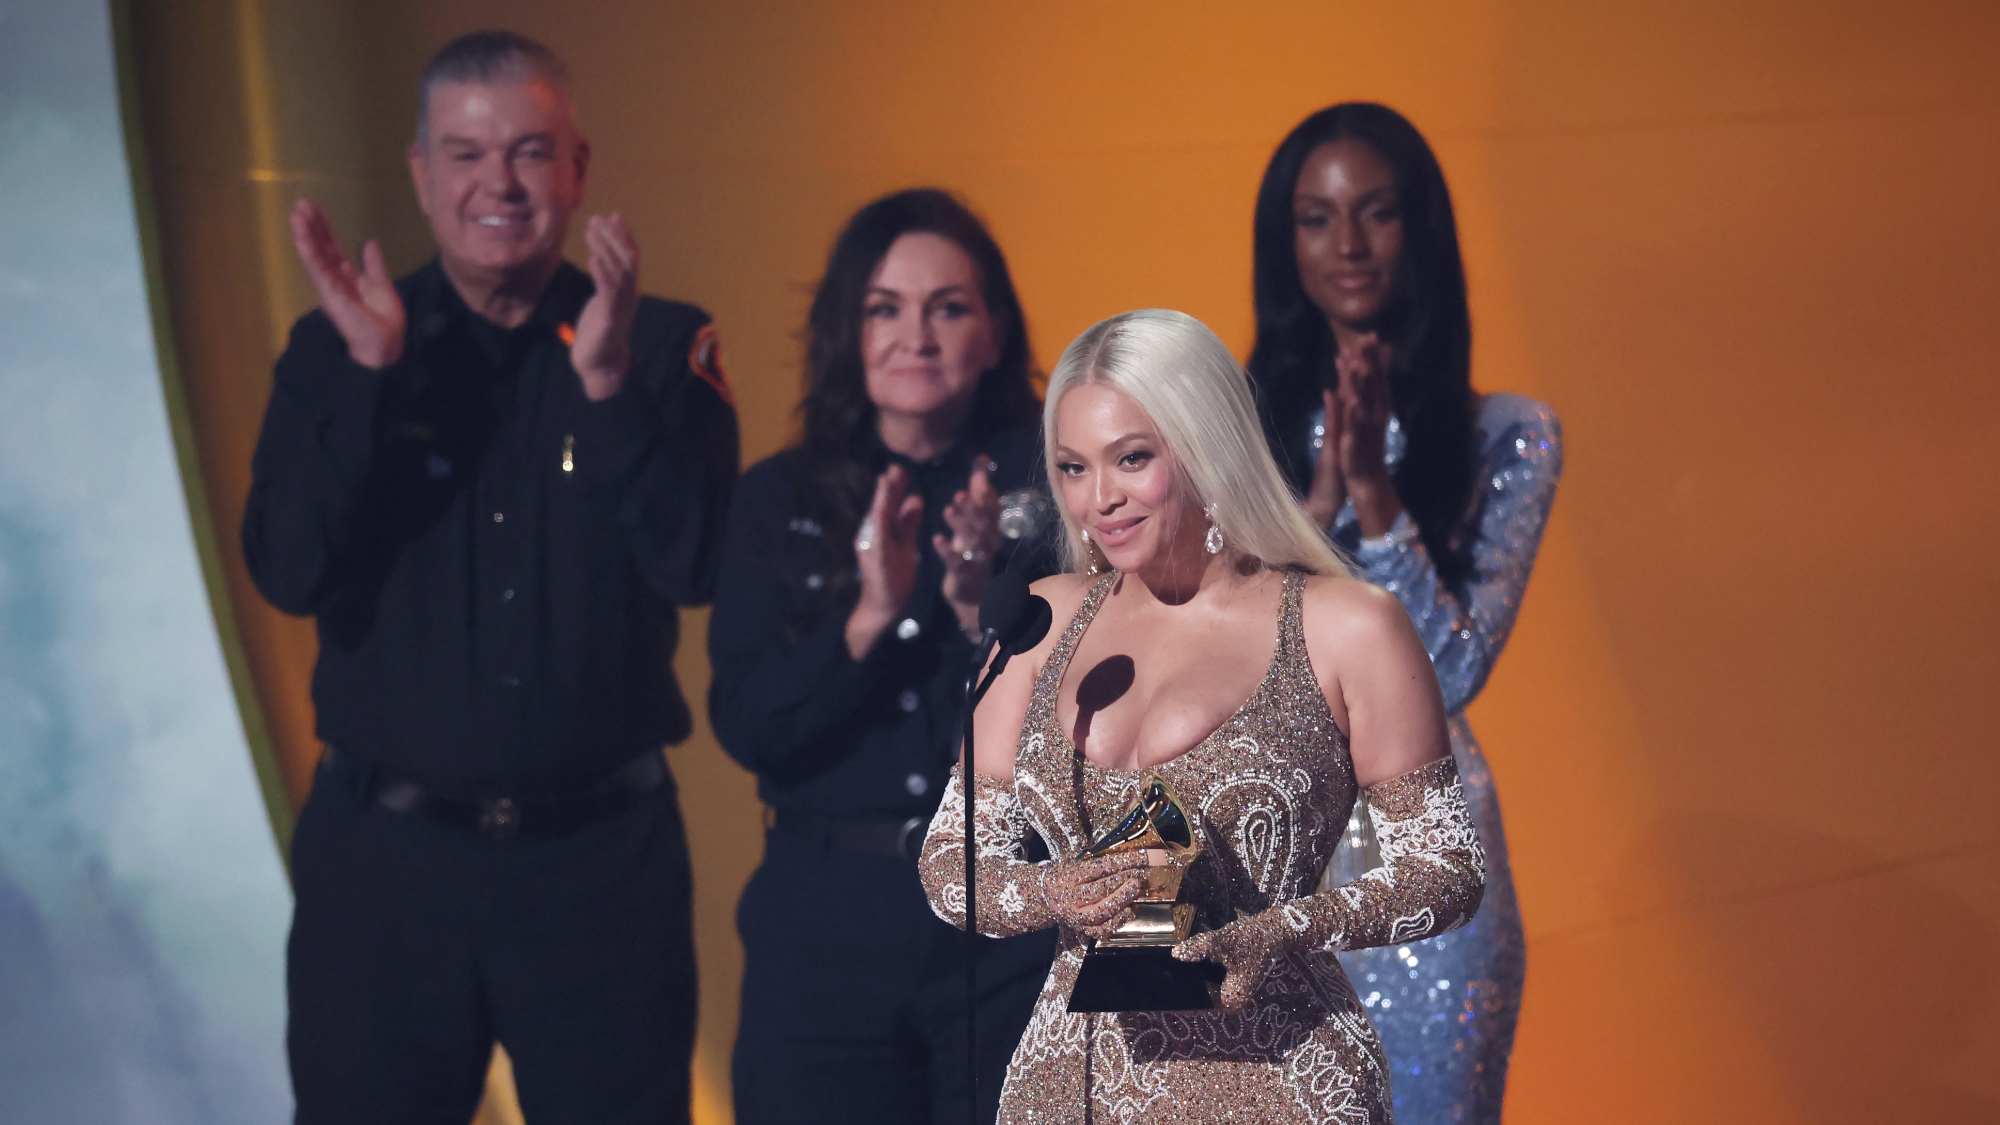 Beyoncé, Kendrick Lamar take top Grammys
Speed Read Beyoncé took home album of the year for 'Cowboy Carter' and Kendrick Lamar's diss track 'Not Like Us' won five awards
-
 The Louvre is giving 'Mona Lisa' her own room
Speed Read The world's most-visited art museum is getting a major renovation
-
 Honda and Nissan in merger talks
Speed Read The companies are currently Japan's second and third-biggest automakers, respectively
-
 Taylor Swift wraps up record-shattering Eras tour
Speed Read The pop star finally ended her long-running tour in Vancouver, Canada
-
 Drake claims illegal boosting, defamation
Speed Read The rapper accused Universal Music of boosting Kendrick Lamar's diss track and said UMG allowed him to be falsely accused of pedophilia


