How the rich devoured the American economy, in one chart

A free daily email with the biggest news stories of the day – and the best features from TheWeek.com
You are now subscribed
Your newsletter sign-up was successful
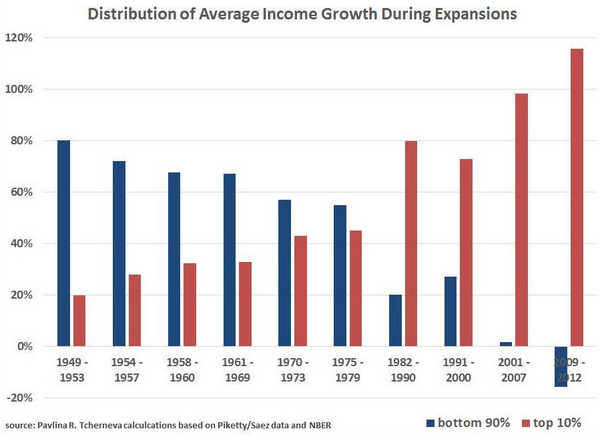
In America, a rising economic tide lifts all boats, right? Not anymore. Pavlina Tcherneva, an economist at Bard College, plotted the distribution of income growth between the bottom 90 percent and the top 10 percent during economic expansions in the United States. The red bars are the richest 10 percent of people, the blue bars are everyone else:
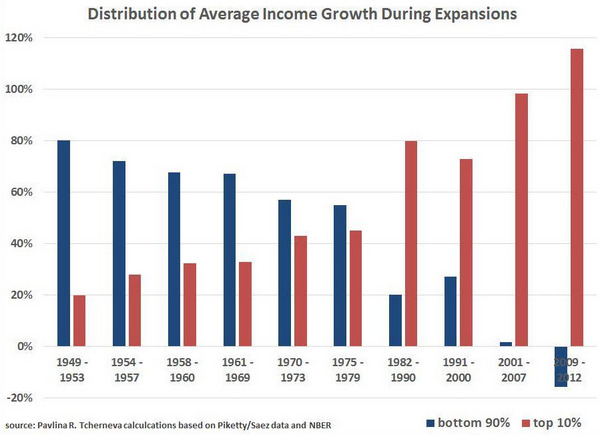
Now, this is only economic expansions, which explains the wonky interval choices at the bottom — 1974 is missing, for example, because that whole year was taken up by recession. Those recessions would also probably claw back some of the rich's income gains, since they get a lot of income from financial assets which crash in price during recessions (see p. 8 here).
But the trend here is undeniable. Economic expansions are supposed to be when the American economy distributes the fruits of growth to everyone. And that used to be true! But slowly and steadily the rich have gained on everyone else. They advance almost regardless of which party is in control of government — Reagan speeds it up, while Clinton slows it down, but not by very much.
The Week
Escape your echo chamber. Get the facts behind the news, plus analysis from multiple perspectives.

Sign up for The Week's Free Newsletters
From our morning news briefing to a weekly Good News Newsletter, get the best of The Week delivered directly to your inbox.
From our morning news briefing to a weekly Good News Newsletter, get the best of The Week delivered directly to your inbox.
Most staggering of all, during our current economic expansion, the bottom 90 percent is posting an average income decline. Not only is the rising tide not lifting everyone equally, it's actually distributing less than nothing to nine-tenths of the population, on average.
A free daily email with the biggest news stories of the day – and the best features from TheWeek.com
Ryan Cooper is a national correspondent at TheWeek.com. His work has appeared in the Washington Monthly, The New Republic, and the Washington Post.
-
 ‘My donation felt like a rejection of the day’s politics’
Instant Opinion Opinion, comment and editorials of the day
-
 Trump wants a weaker dollar but economists aren’t so sure
Talking Points A weaker dollar can make imports more expensive but also boost gold
-
 Political cartoons for February 3
Cartoons Tuesday’s political cartoons include empty seats, the worst of the worst of bunnies, and more
-
 TikTok secures deal to remain in US
Speed Read ByteDance will form a US version of the popular video-sharing platform
-
 Unemployment rate ticks up amid fall job losses
Speed Read Data released by the Commerce Department indicates ‘one of the weakest American labor markets in years’
-
 US mints final penny after 232-year run
Speed Read Production of the one-cent coin has ended
-
 Warner Bros. explores sale amid Paramount bids
Speed Read The media giant, home to HBO and DC Studios, has received interest from multiple buying parties
-
 Gold tops $4K per ounce, signaling financial unease
Speed Read Investors are worried about President Donald Trump’s trade war
-
 Electronic Arts to go private in record $55B deal
speed read The video game giant is behind ‘The Sims’ and ‘Madden NFL’
-
 New York court tosses Trump's $500M fraud fine
Speed Read A divided appeals court threw out a hefty penalty against President Trump for fraudulently inflating his wealth
-
 Trump said to seek government stake in Intel
Speed Read The president and Intel CEO Lip-Bu Tan reportedly discussed the proposal at a recent meeting
