3 key graphics from the U.N. climate report
These charts offer a snapshot of what will happen in the coming decades if warming continues

A free daily email with the biggest news stories of the day – and the best features from TheWeek.com
You are now subscribed
Your newsletter sign-up was successful
The U.N. Intergovernmental Panel on Climate Change (IPCC) released its 2023 climate report detailing what the panel's chair, Hoesung Lee, called "the urgency of taking more ambitious [climate] action."
The report found that the world is pushing towards 1.5 degrees Celsius of warming over pre-industrial levels and will likely surpass that temperature in "the first half of the 2030s," The New York Times reported. The 1.5-degree threshold was proposed in the 2015 Paris Climate Agreement. If the Earth warms beyond that level, ecological problems become much more likely and extreme. The planet has already warmed by 1.1 degrees Celsius.
The IPCC did not entirely rule out the possibility that we could limit the warming, but emphasized that significant action to reduce emissions must be taken now. "Humanity is on thin ice — and that ice is melting fast," said United Nations Secretary-General, according to The Associated Press. "Our world needs climate action on all fronts — everything, everywhere, all at once."
The Week
Escape your echo chamber. Get the facts behind the news, plus analysis from multiple perspectives.

Sign up for The Week's Free Newsletters
From our morning news briefing to a weekly Good News Newsletter, get the best of The Week delivered directly to your inbox.
From our morning news briefing to a weekly Good News Newsletter, get the best of The Week delivered directly to your inbox.
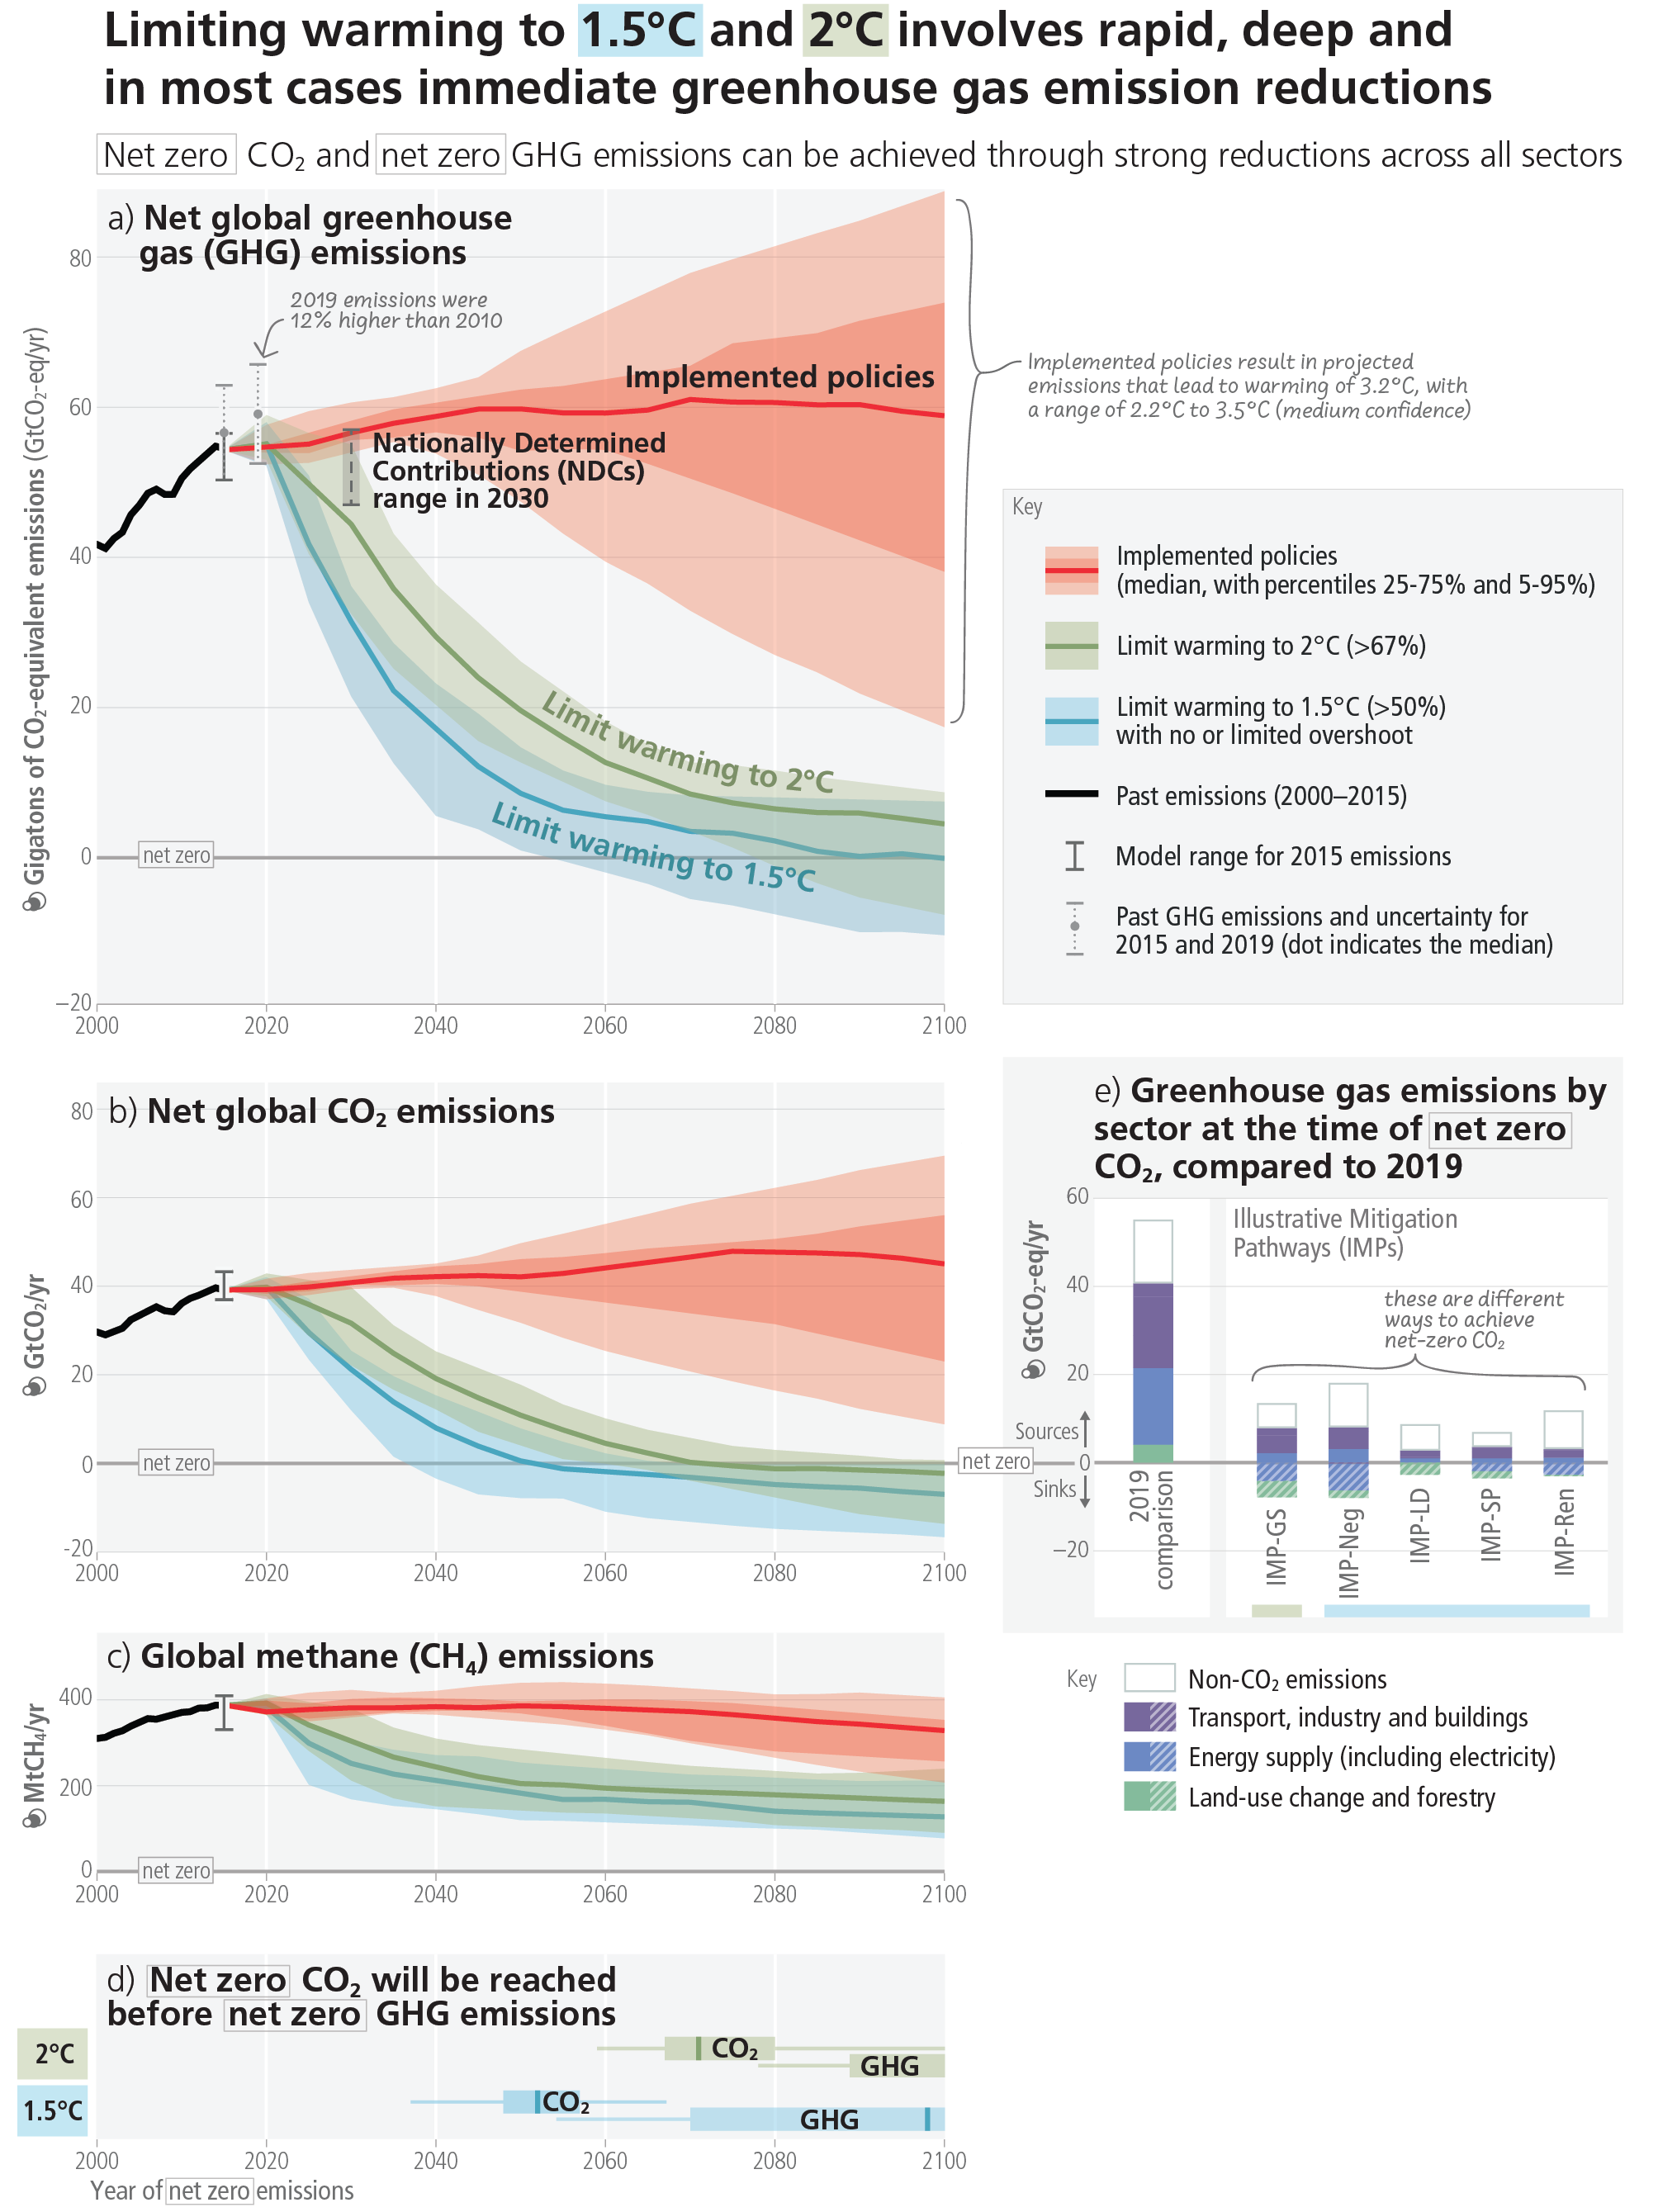
The above graphic (Figure SPM.5) details the different trajectories the climate can take depending on whether we stick to current emissions policies or we opt to reduce our emissions. According to the model, emissions have to be curbed substantially to limit the temperature rise to even 2 degrees Celsius. The IPCC advises rich countries to achieve net zero emissions by 2040, and developing nations by 2050, which is a decade earlier than previously expected, per AP. Fossil fuel usage is still the largest contributor of global emissions, with the U.S. and China leading in the category. The Biden administration also recently approved the controversial Willow Project, which will drive up emissions over the next 30 years. "The pace and scale of what has been done so far and current plans are insufficient to tackle climate change," said Lee, according to the Times. "We are walking when we should be sprinting."
The damaging effects of global warming are not distributed equally. Poor countries, as well as low island nations, are far more vulnerable to the temperature change, facing risks of drought, flooding, and other loss and damage, The Washington Post explained. "Climate justice is crucial because those who have contributed least to climate change are being disproportionately affected," said Aditi Mukherji, one of the authors of the report, in a press release.
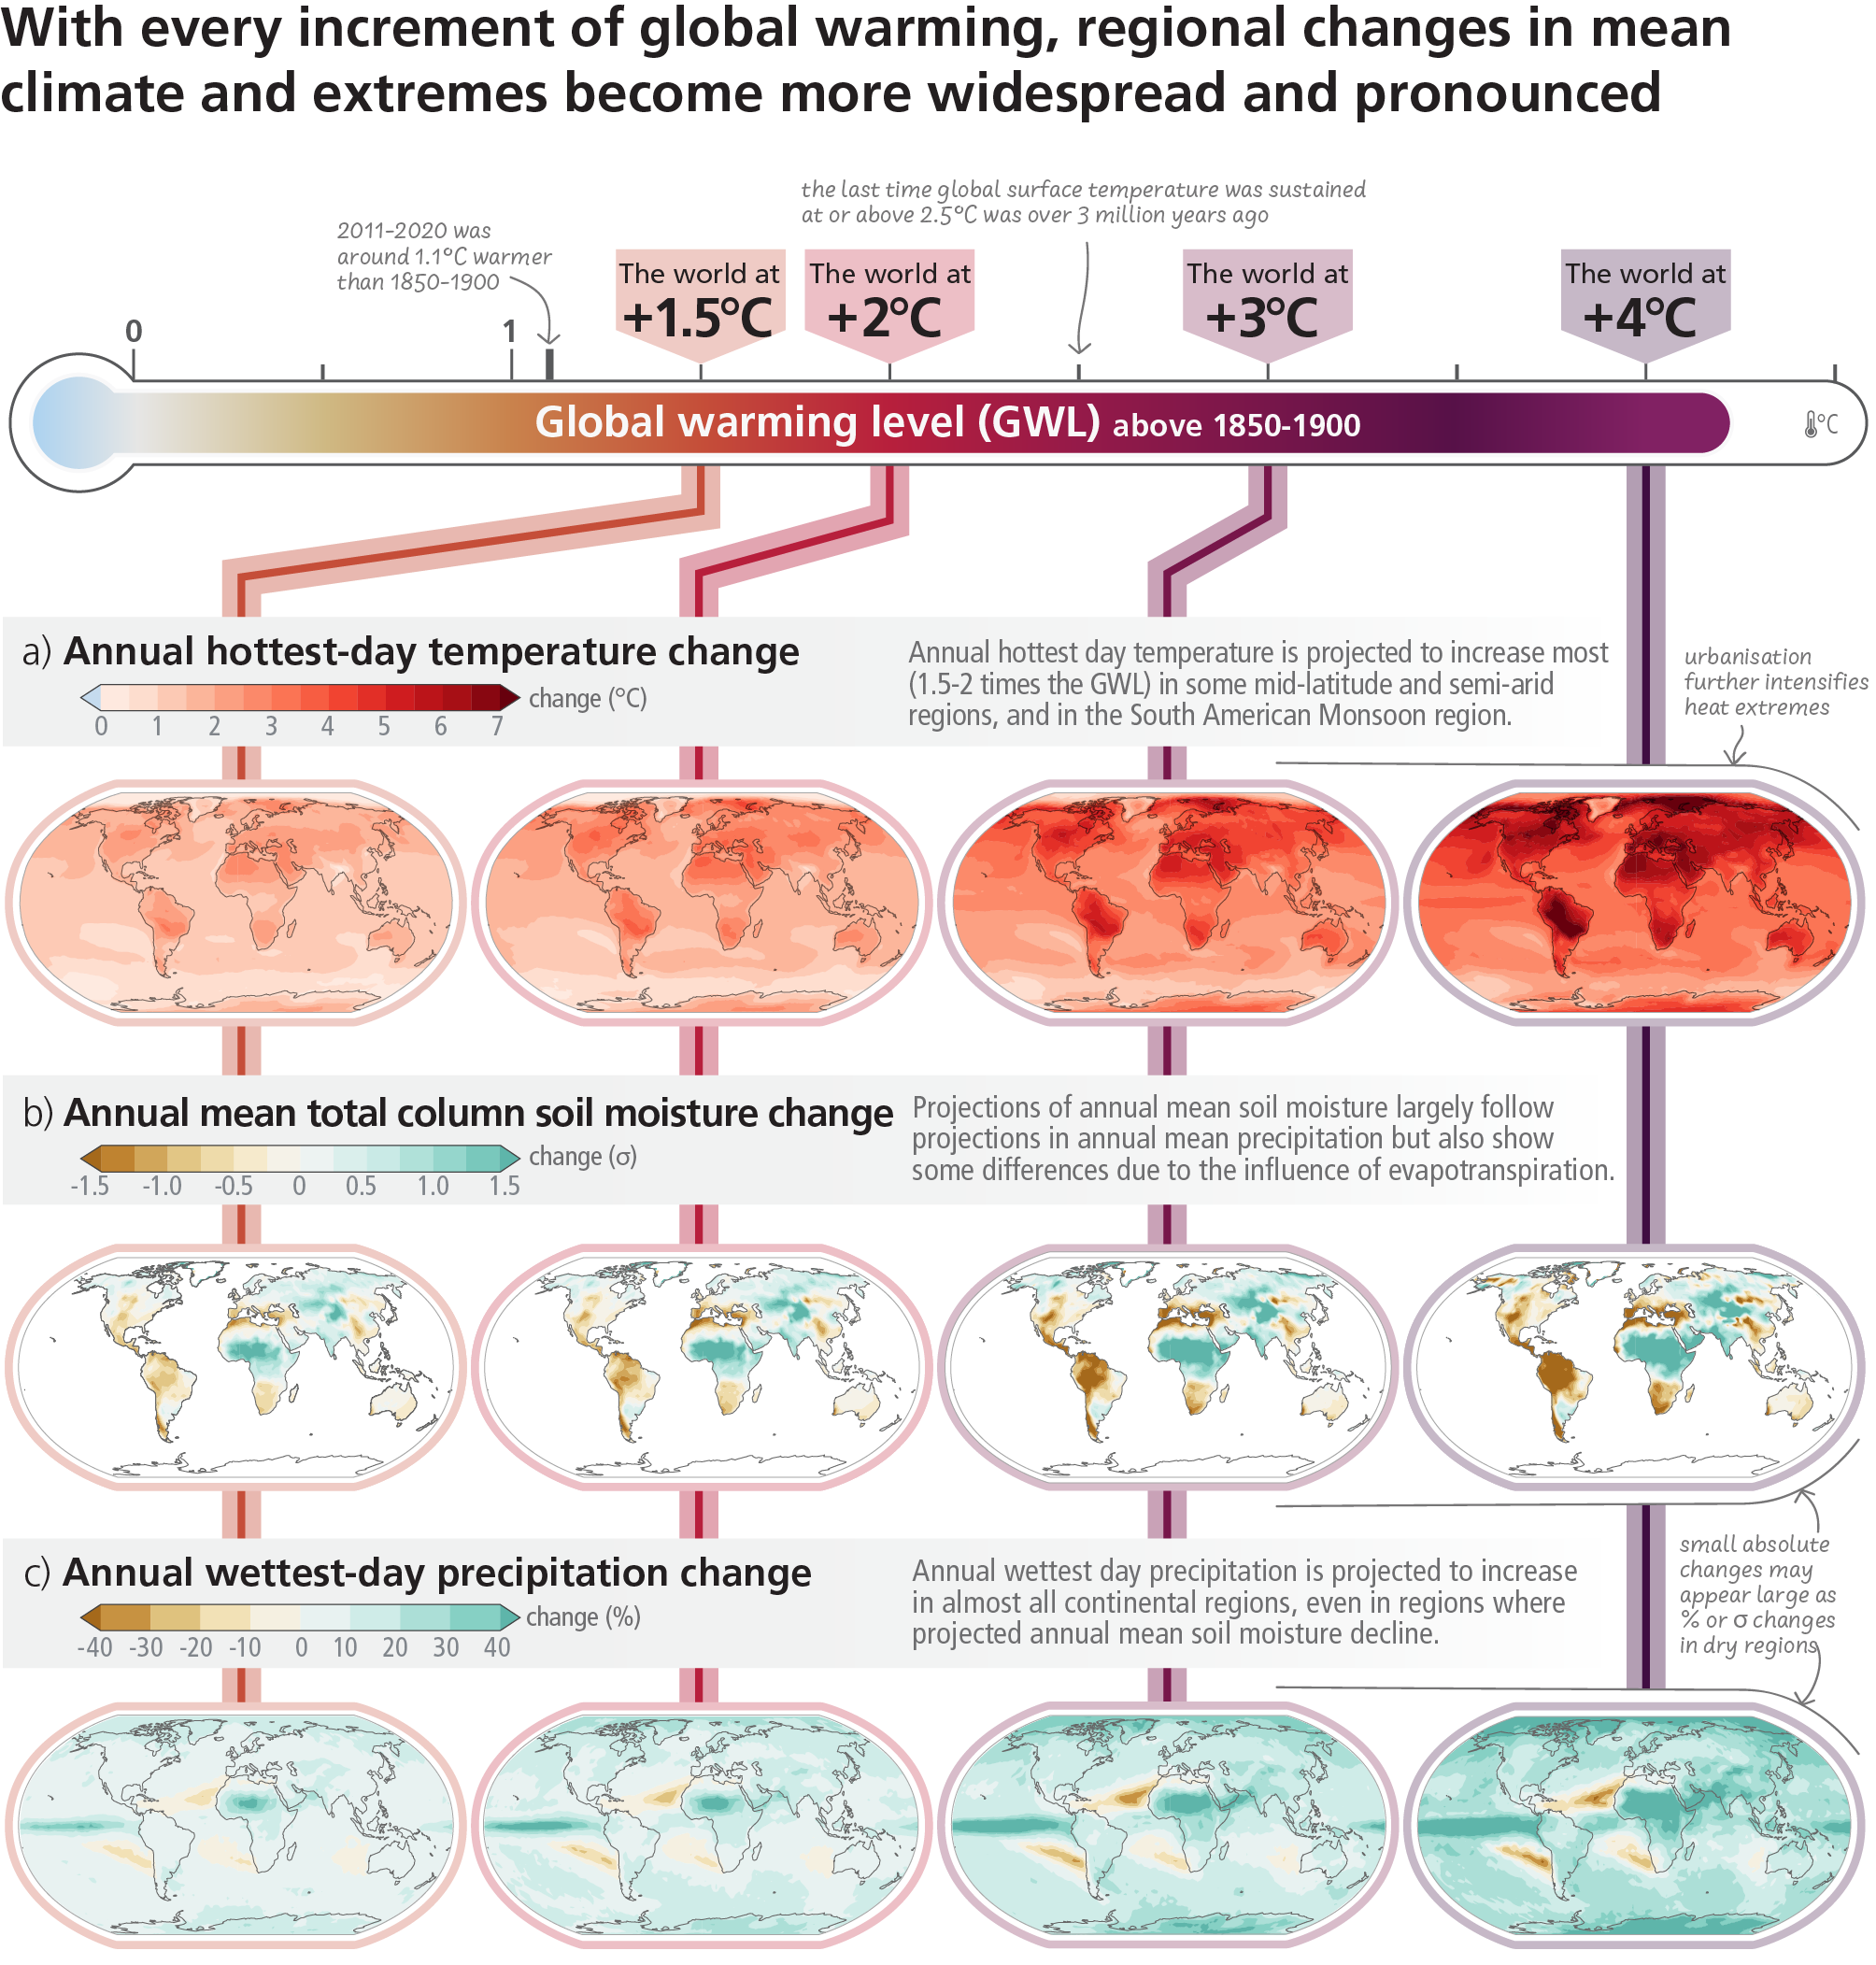
Per the graphic above (Figure SPM.2), as the average annual temperature rises, extremes rise along with it. Even in conditions of 1.5-degree warming, wet areas become wetter, dry areas become drier, and the contrast exacerbates as the temperature rises. "There's clear evidence that 1.5 is better than 1.6, which is better than 1.7, and so on," Joeri Rogelj, the director of research at the Grantham Institute for Climate Change and the Environment, told the Times. "The point is we need to do everything we can to keep warming as low as possible."
Ani Dasgupta, president and CEO of the World Resources Institute said in a statement that "our planet is already reeling from severe climate impacts, from scorching heat waves and destructive storms to severe droughts and water shortages." In turn, these outcomes are also damaging biodiversity, food production, and human health, as depicted in the graphic below (Figure SPM.3).
A free daily email with the biggest news stories of the day – and the best features from TheWeek.com
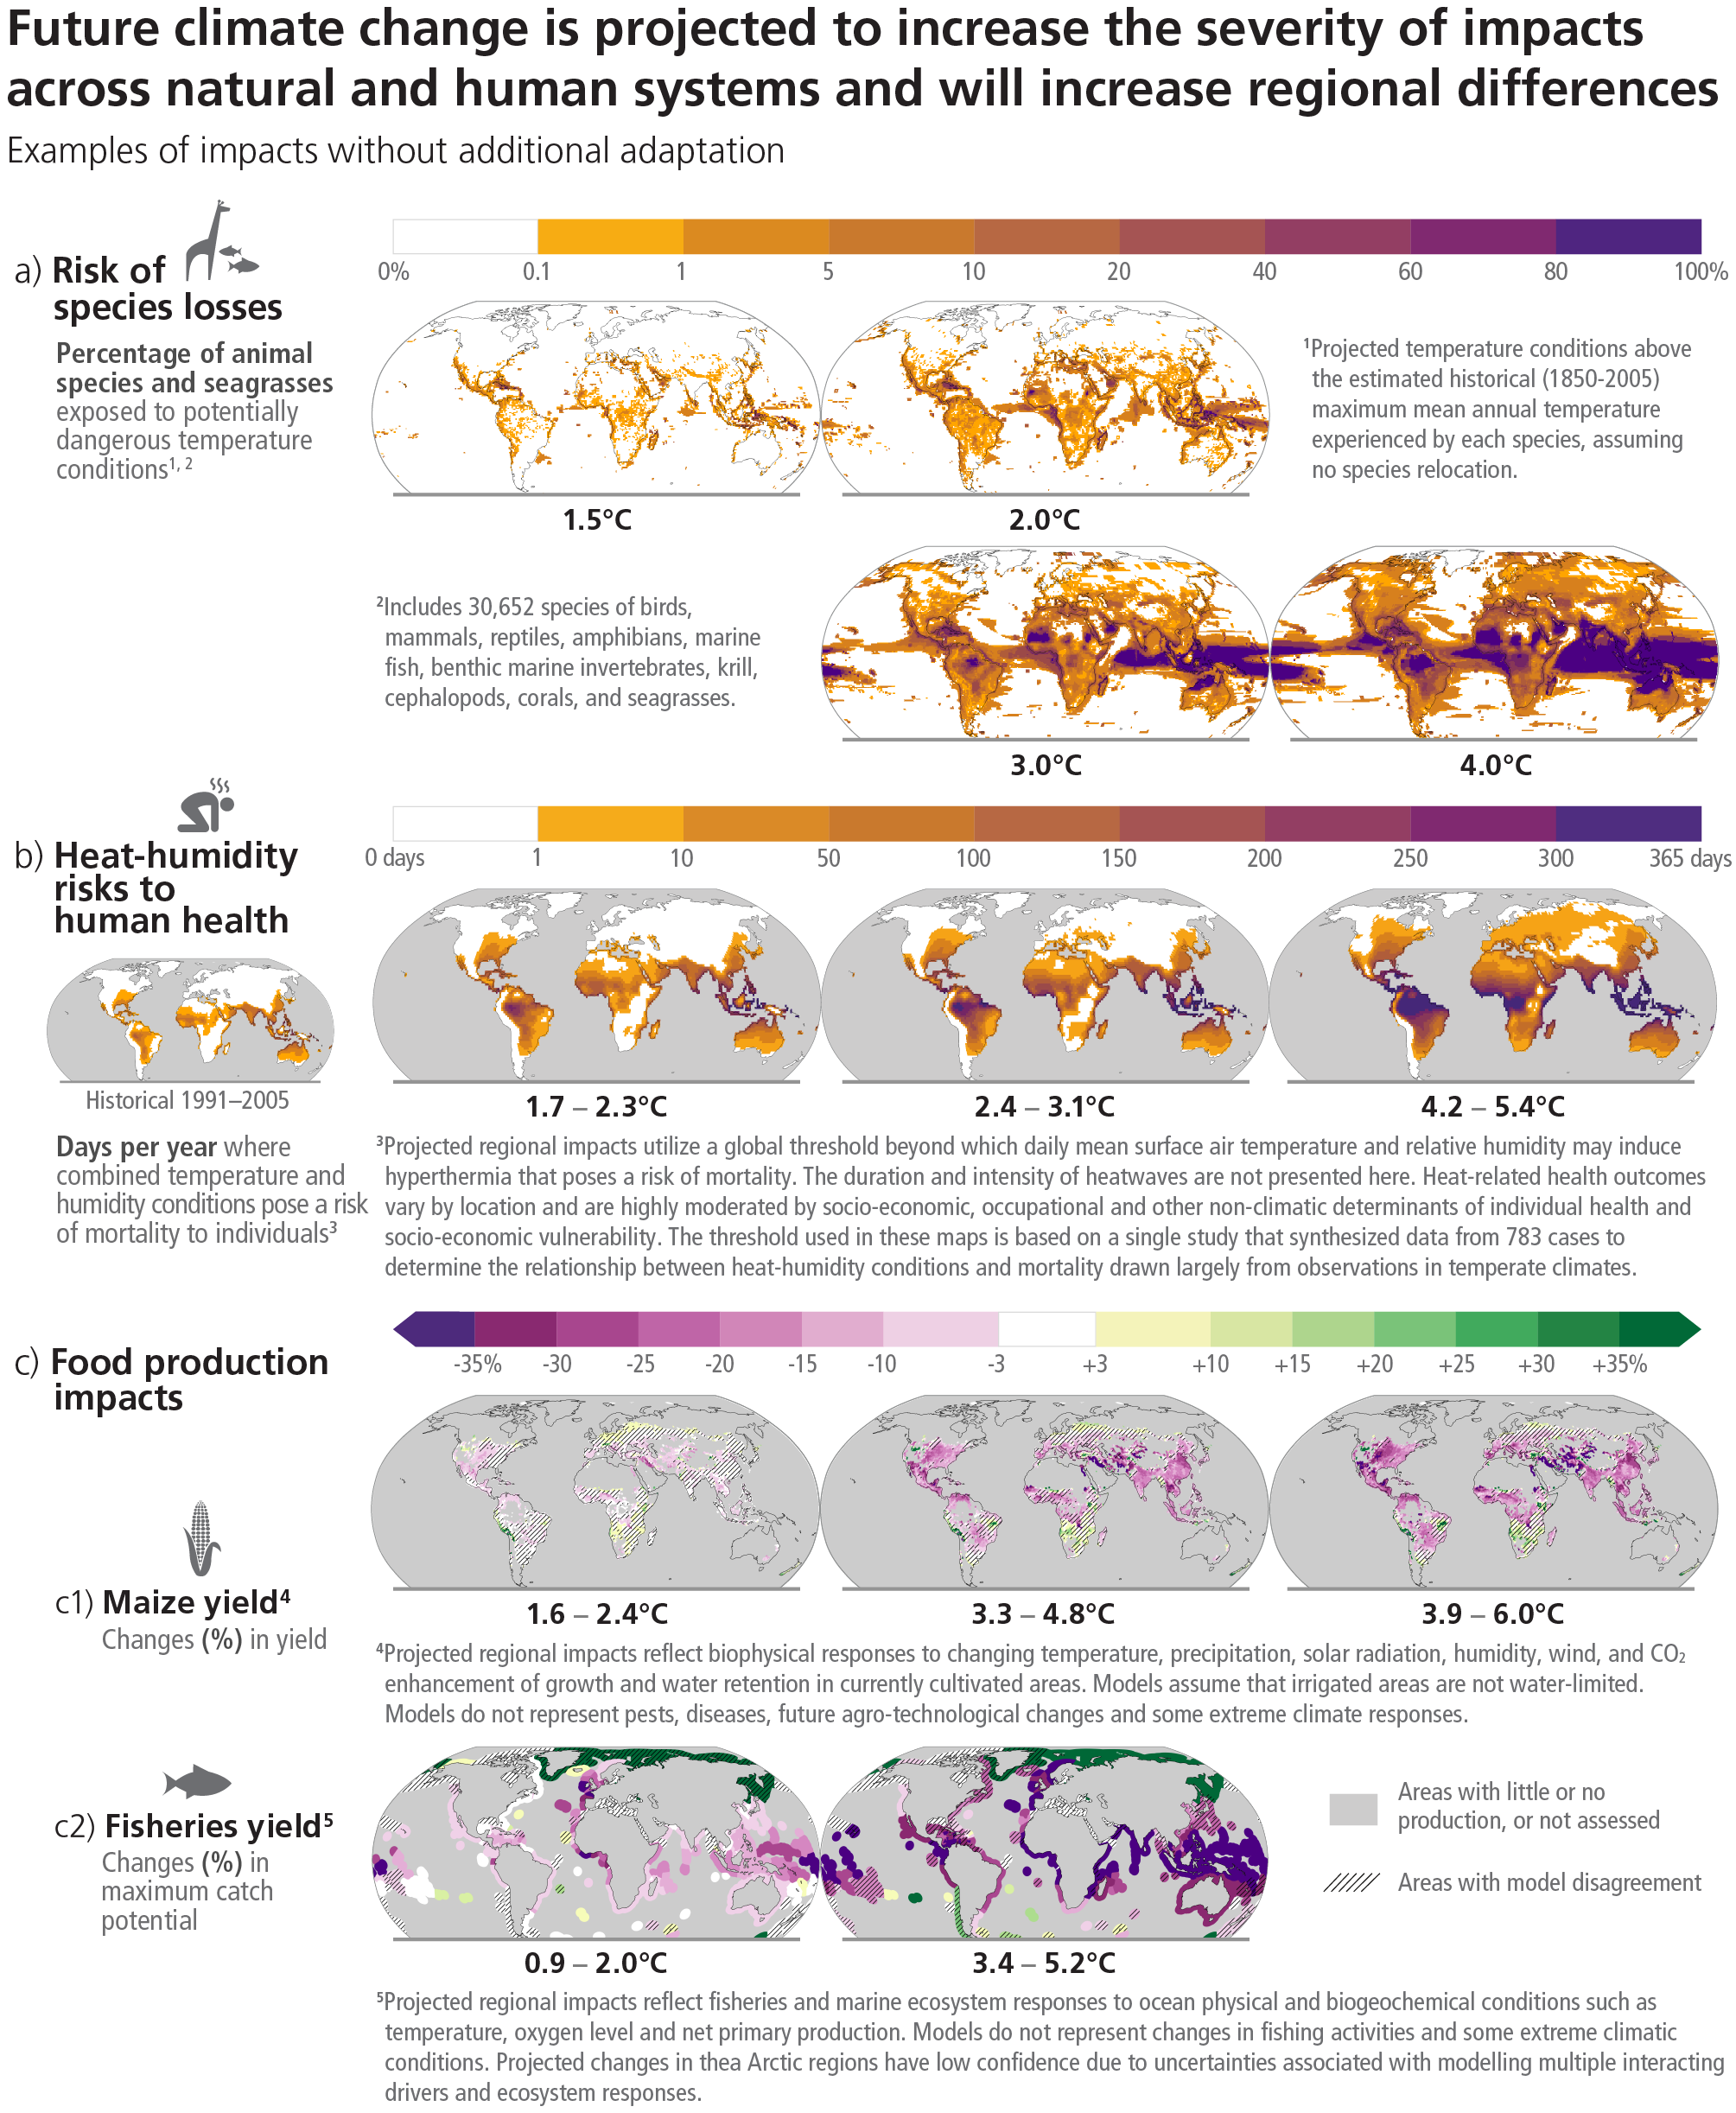
Warming temperatures increase the spread of disease, potentially leading to more pandemics in the future. Also, there is likely to be more conflict between humans and wildlife as habitats shift. "With every increment of global warming, the danger will increase," Christopher Trisos, director of the Climate Risk Lab at the University of Cape Town, explained to the Post. "As we leave it later and take hotter and hotter exits, the fewer options we have to thrive."
Even with this, scientists say that 1.5 degrees of warming does not mean all is lost. In reality, "accelerated action to adapt to climate change is essential to close the gap between existing adaptation and what is needed," the IPCC wrote. IPCC report review editor Steven Rose told AP: "It is certainly prudent to be planning for a future that's warmer than 1.5 degrees."
"Today's IPCC report is a how-to guide to defuse the climate time-bomb," Guterres said. "But it will take a quantum leap in climate action."
Devika Rao has worked as a staff writer at The Week since 2022, covering science, the environment, climate and business. She previously worked as a policy associate for a nonprofit organization advocating for environmental action from a business perspective.
-
 Trump wants a weaker dollar but economists aren’t so sure
Talking Points A weaker dollar can make imports more expensive but also boost gold
-
 Political cartoons for February 3
Cartoons Tuesday’s political cartoons include empty seats, the worst of the worst of bunnies, and more
-
 Trump’s Kennedy Center closure plan draws ire
Speed Read Trump said he will close the center for two years for ‘renovations’
-
 How climate change is affecting Christmas
The Explainer There may be a slim chance of future white Christmases
-
 Why scientists are attempting nuclear fusion
The Explainer Harnessing the reaction that powers the stars could offer a potentially unlimited source of carbon-free energy, and the race is hotting up
-
 Canyons under the Antarctic have deep impacts
Under the radar Submarine canyons could be affecting the climate more than previously thought
-
 NASA is moving away from tracking climate change
The Explainer Climate missions could be going dark
-
 What would happen to Earth if humans went extinct?
The Explainer Human extinction could potentially give rise to new species and climates
-
 Bacteria can turn plastic waste into a painkiller
Under the radar The process could be a solution to plastic pollution
-
 A zombie volcano is coming back to life, but there is no need to worry just yet
Under the radar Uturuncu's seismic activity is the result of a hydrothermal system
-
 'Bioelectric bacteria on steroids' could aid in pollutant cleanup and energy renewal
Under the radar The new species is sparking hope for environmental efforts
